Product Quiz Metrics: What to Track to Convert Better
Your quiz produces a lot of data, but only a handful of numbers tell you what to fix. This guide covers the metrics that matter, where to find them, and the concrete move to make when each one is underperforming.
Where to find your data
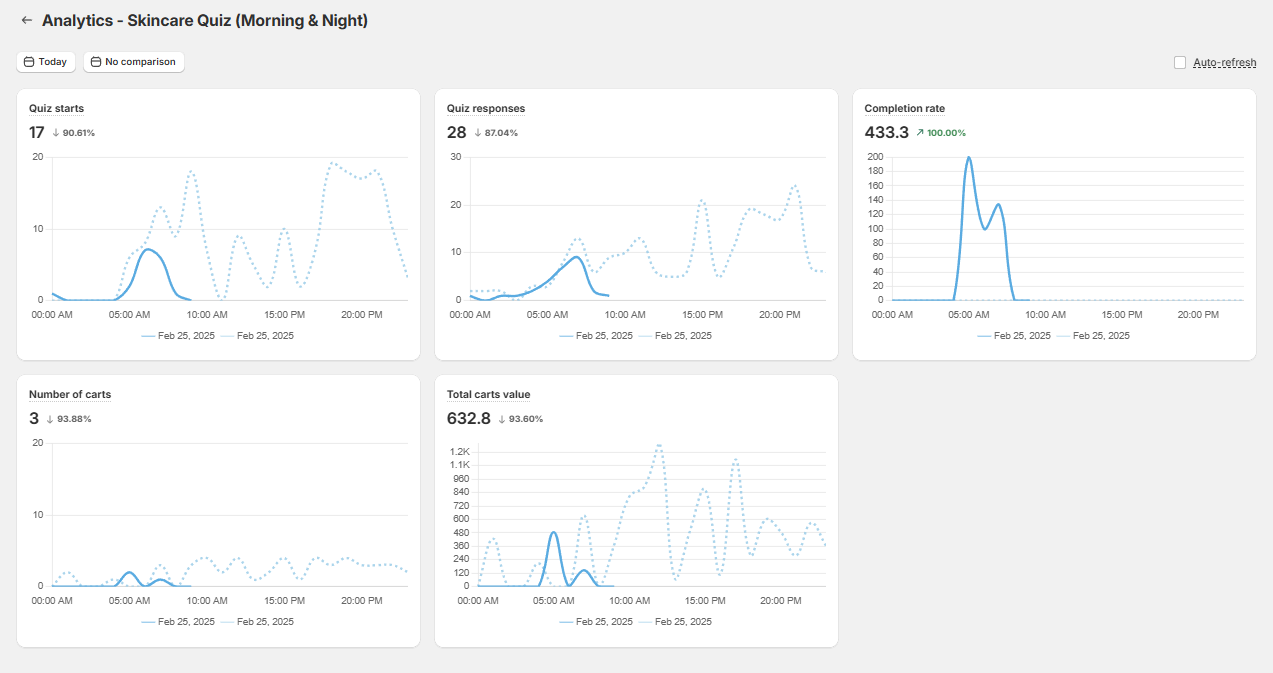
Everything the quiz collects lives in the Metrics and Analytics panel. Three views do most of the work.
Responses shows every submission by date, with the choices each customer made, which products were recommended, and which customer tags they picked up. Open one to see a single shopper's full journey.
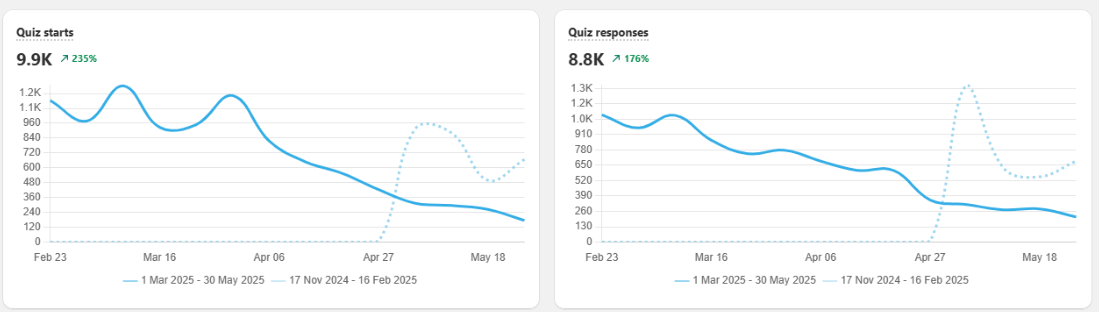
Analytics charts engagement, conversion, and revenue over time, so you can compare periods or quizzes.
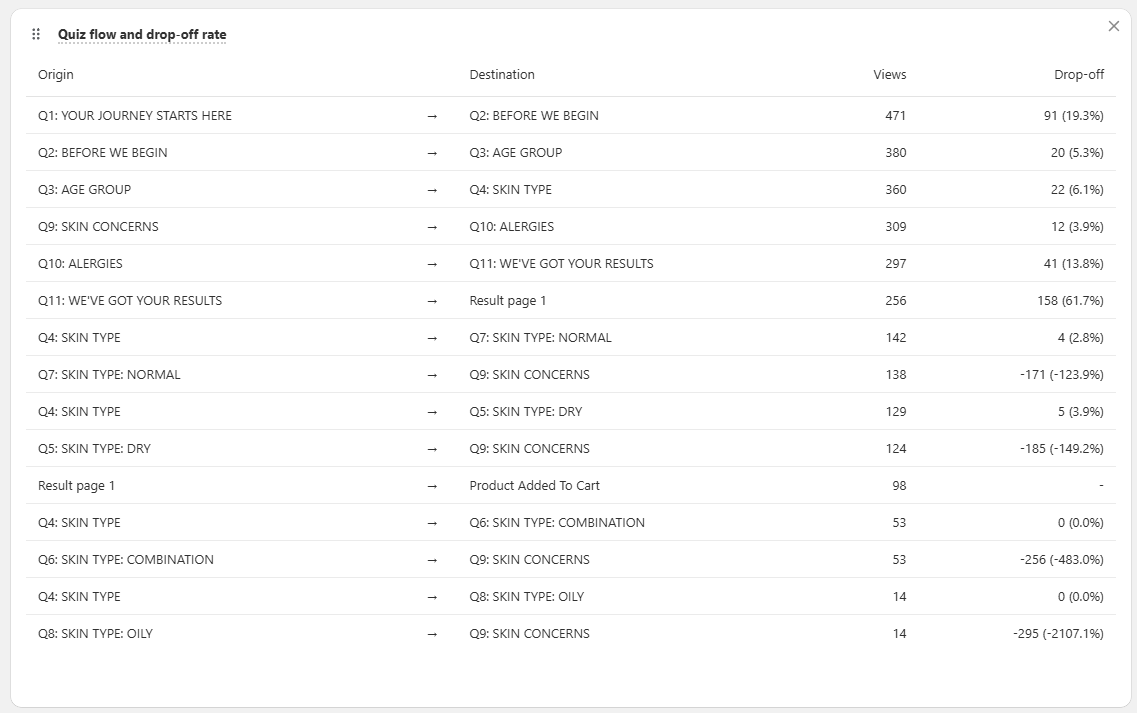
Drop-off breaks down where people leave, question by question, so you can fix the right step instead of guessing.
For deeper analysis, export responses to CSV and slice them in a spreadsheet, or connect GA4 and the Meta Pixel to track traffic source, per-choice clicks, and revenue.
Trust your first-party numbers in 2026
As third-party cookies and pixels lose accuracy, the quiz's own metrics and native revenue tracking are the most reliable signal you have. Lean on them rather than pixel-attributed numbers alone, and remember that about 1 in 5 quiz orders land more than 30 days later, so judge performance on a long enough window.
Engagement metrics
Engagement tells you whether people find the quiz and finish it.
Quiz starts and completions. Starts count everyone who passes the first slide; completions count everyone who reaches the results page. A healthy gap between them is normal, but a wide one points to a question problem.
Completion rate. This is the clearest measure of how engaging and easy the quiz is.
Completion rate formula
Completion rate (%) = (quiz completions ÷ quiz starts) × 100
Aim as high as you can: a well-built quiz finishes around 70% of starts, and a short, sharp quiz can clear 80%. If yours is lower, the quiz is usually too long or a question is causing friction. See How to Reduce Drop-Off.
Drop-off points. The per-question drop-off shows exactly where people quit, so you can rewrite or cut that one question rather than overhauling the whole quiz.
| Issue | What to do |
|---|---|
| Low quiz starts | Make the quiz more visible (publish it in several places), promote it, and run ads to it. See How to Get More People to Take Your Quiz. |
| Low completion rate | Shorten the quiz, turn dense questions into picture questions, and move personal questions (name, email, phone) toward the end. |
Revenue metrics
Revenue metrics connect the quiz to money. Connect your quiz to Shopify Customers and revenue reports so orders and their value flow into the panel.
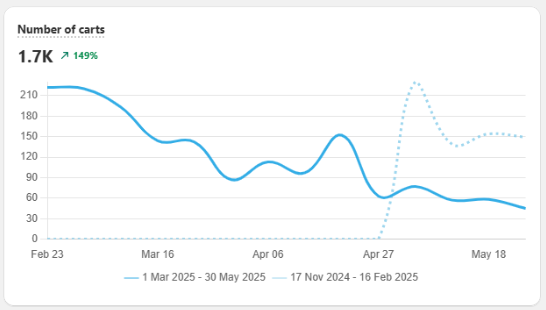
Carts and cart value. Track how many quiz takers reach the cart and what those carts are worth. Strong cart numbers mean the recommendations are landing.
Average order value.
Average order value formula
Average order value = total orders value ÷ number of orders
Measured within the same store, quiz orders typically run 11-15% larger than non-quiz orders, and more in categories like beauty and skincare. If yours is flat, the results page is treating the shopper like cold traffic, so recommend a set or routine instead of a single item.
Conversion rate.
Conversion rate formula
Conversion rate (%) = (purchases after completion ÷ total completions) × 100
A good quiz lifts conversion on quiz traffic well above the site average, often from around 2% to 5% or higher. When it lags, work through the table below.
| Issue | What to do |
|---|---|
| Customers don't add to cart | Confirm the quiz returns recommendations, check checkout settings, limit recommendations to one product (or one per routine step), make the CTA stand out, and offer a discount. |
| Low conversion rate | Limit the number of recommended products, offer a discount, and set up a post-quiz email flow to recapture lost revenue. |
| They add to cart but don't buy | Offer a discount and set up a post-quiz email flow. |
| Customers buy only once | Refresh the quiz over time, then segment buyers and follow up with targeted campaigns and subscriptions. |
Recommendation insights
This view tells you whether your recommendations are working and which products earn their place.
Most clicked and most purchased products. The products that get clicked and bought most are your proven performers. Feature them more prominently in the quiz and in promotion.
Least purchased products. Products that get recommended but rarely bought need a look: the price, the appeal, or the mapping may be off. Improve them or swap them out.
| Issue | What to do |
|---|---|
| The same products always win | Use the responses troubleshooter to check whether some products get more votes by default, then diversify by adding a question or mapping more products to choices. |
| Customers get empty recommendations | Confirm the results page has a product or slot block, that choices are mapped to products or collections, and that you aren't excluding too many products. |
Customer insights
The quiz is also a research tool. Used well, it tells you who your customers are and what they want.
Most clicked choices. The answers customers pick most reveal their real priorities. Use them to sharpen your questions and your merchandising. Pull this from a CSV export or GA4.
Customer tags. Tags collected from answers segment your audience automatically, which is what powers personalized, higher-return follow-up campaigns.
| Issue | What to do |
|---|---|
| I don't know who my customers are | Read the Responses panel and use customer tags to group shoppers by answer (age, concern, goal) into buyer personas. |
| I don't know how to get repeat purchases | Segment with tags and run targeted CRM campaigns, offer loyalty or subscriptions, and send personalized follow-ups based on quiz answers. |
Do / Don't
- Do watch completion rate and per-question drop-off first. They tell you where the funnel is leaking.
- Do compare metrics over time and against past periods, not in isolation.
- Do connect GA4 and the Meta Pixel for deeper data like traffic source, revenue, and clicks per choice.
- Don't judge the quiz on starts alone. Completion and revenue are what matter.
- Don't act on a single day's numbers. Quiz-attributed orders keep landing for weeks.
Frequently asked questions
Which quiz metric matters most?
Completion rate (completions divided by starts) and the revenue metrics. High starts with low completion points to question design; low starts point to visibility.
Where do I find the data?
In the Metrics and Analytics panel (responses, analytics, and drop-off), or by exporting all responses to a CSV.
Why track over a long window?
Because quiz-attributed orders keep arriving: about 1 in 5 land more than 30 days after the quiz, so a short window understates the quiz's impact.