Metrics
Quiz metrics are can be found in several sections:
- Analytics Overview can be found in the Dashboard.
- Individual quiz responses can be found in the Responses section.
- Full customizable analytics can be found in the Analytics section.
In the Metrics section of the Quiz Builder, you can find individual quiz responses and analytics.
In the Metrics section of the Quiz Builder, you can find individual quiz responses and analytics.
In the Metrics section of the Quiz Builder, you can find individual quiz responses and analytics.
In the Metrics section of the Quiz Builder, you can find individual quiz responses and analytics.
In the Metrics section of the Quiz Builder, you can find individual quiz responses and analytics.
Responses
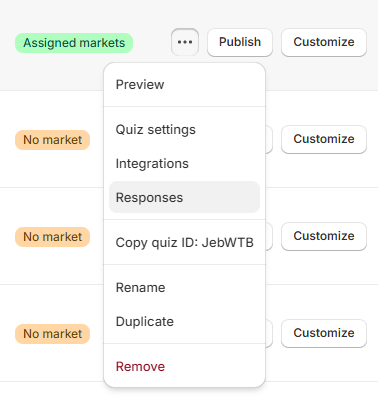
To open the Responses section, go back to the Dashboard, pick a quiz, click ... to open the quiz menu, then click Responses.
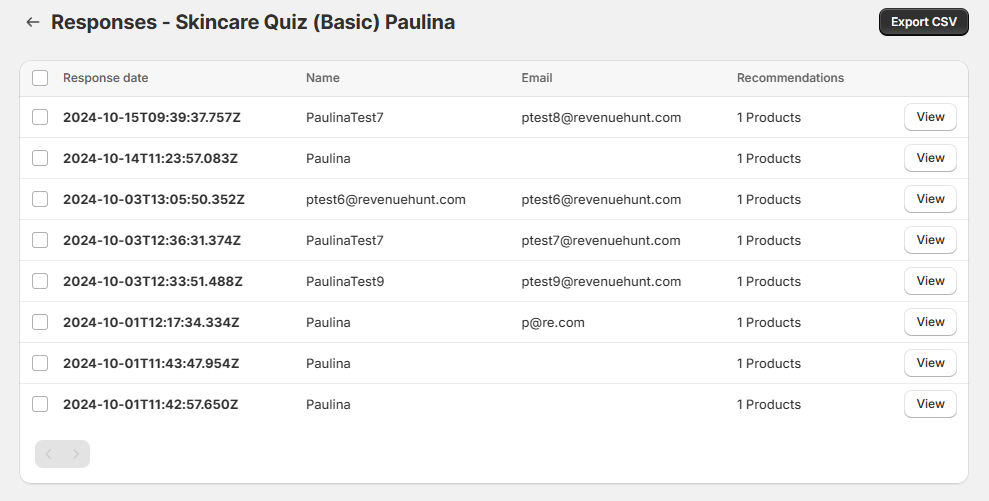
In the Responses section you will find a list of the latest quiz responses sorted by date.
Test responses removal
Admin responses and quiz previews are removed from the list after an hour so they do not count towards your plan limits.
All / With recommendations / No recommendations - Switch to filter responses that received product recommendations and those that did not.
Export CSV - Download the selected responses in a CSV file format. A popup opens where you pick the email address to send the CSV file to. For security reasons, exports can only be sent to your shop's contact email or pre-authorized email addresses. Contact support to add additional authorized emails.
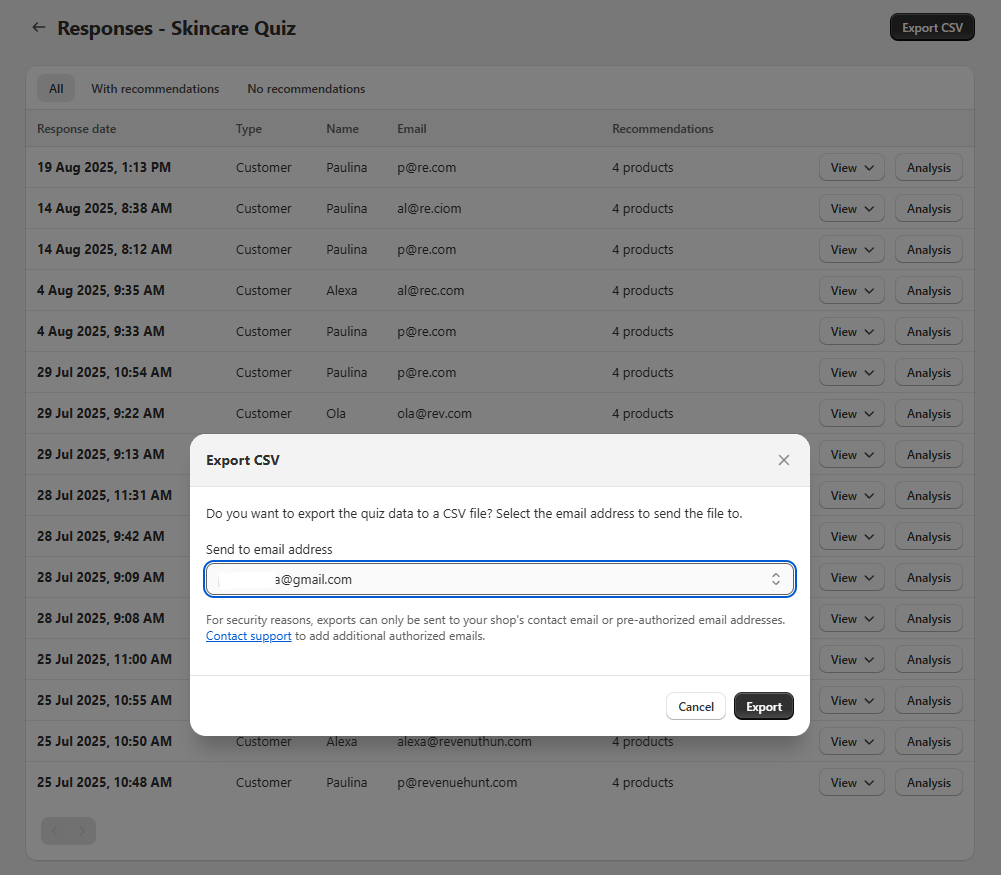
Response date - The date and time the response has been submitted.
Type - The type of quiz response, for example Preview or Customer. Preview responses are created when you click the Preview button in the quiz builder. Customer responses are created when a customer completes the quiz on the live site.
Name - Name provided by the customer.
Email - Email provided by the customer.
Recommendations - The number of recommended products.
View - Opens a menu with two options.
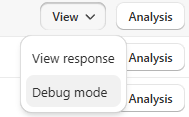
View response- Opens the response in a new tab.Debug mode- Opens the response in debug mode.
Analysis - A separate button next to View. Opens the response analysis page.
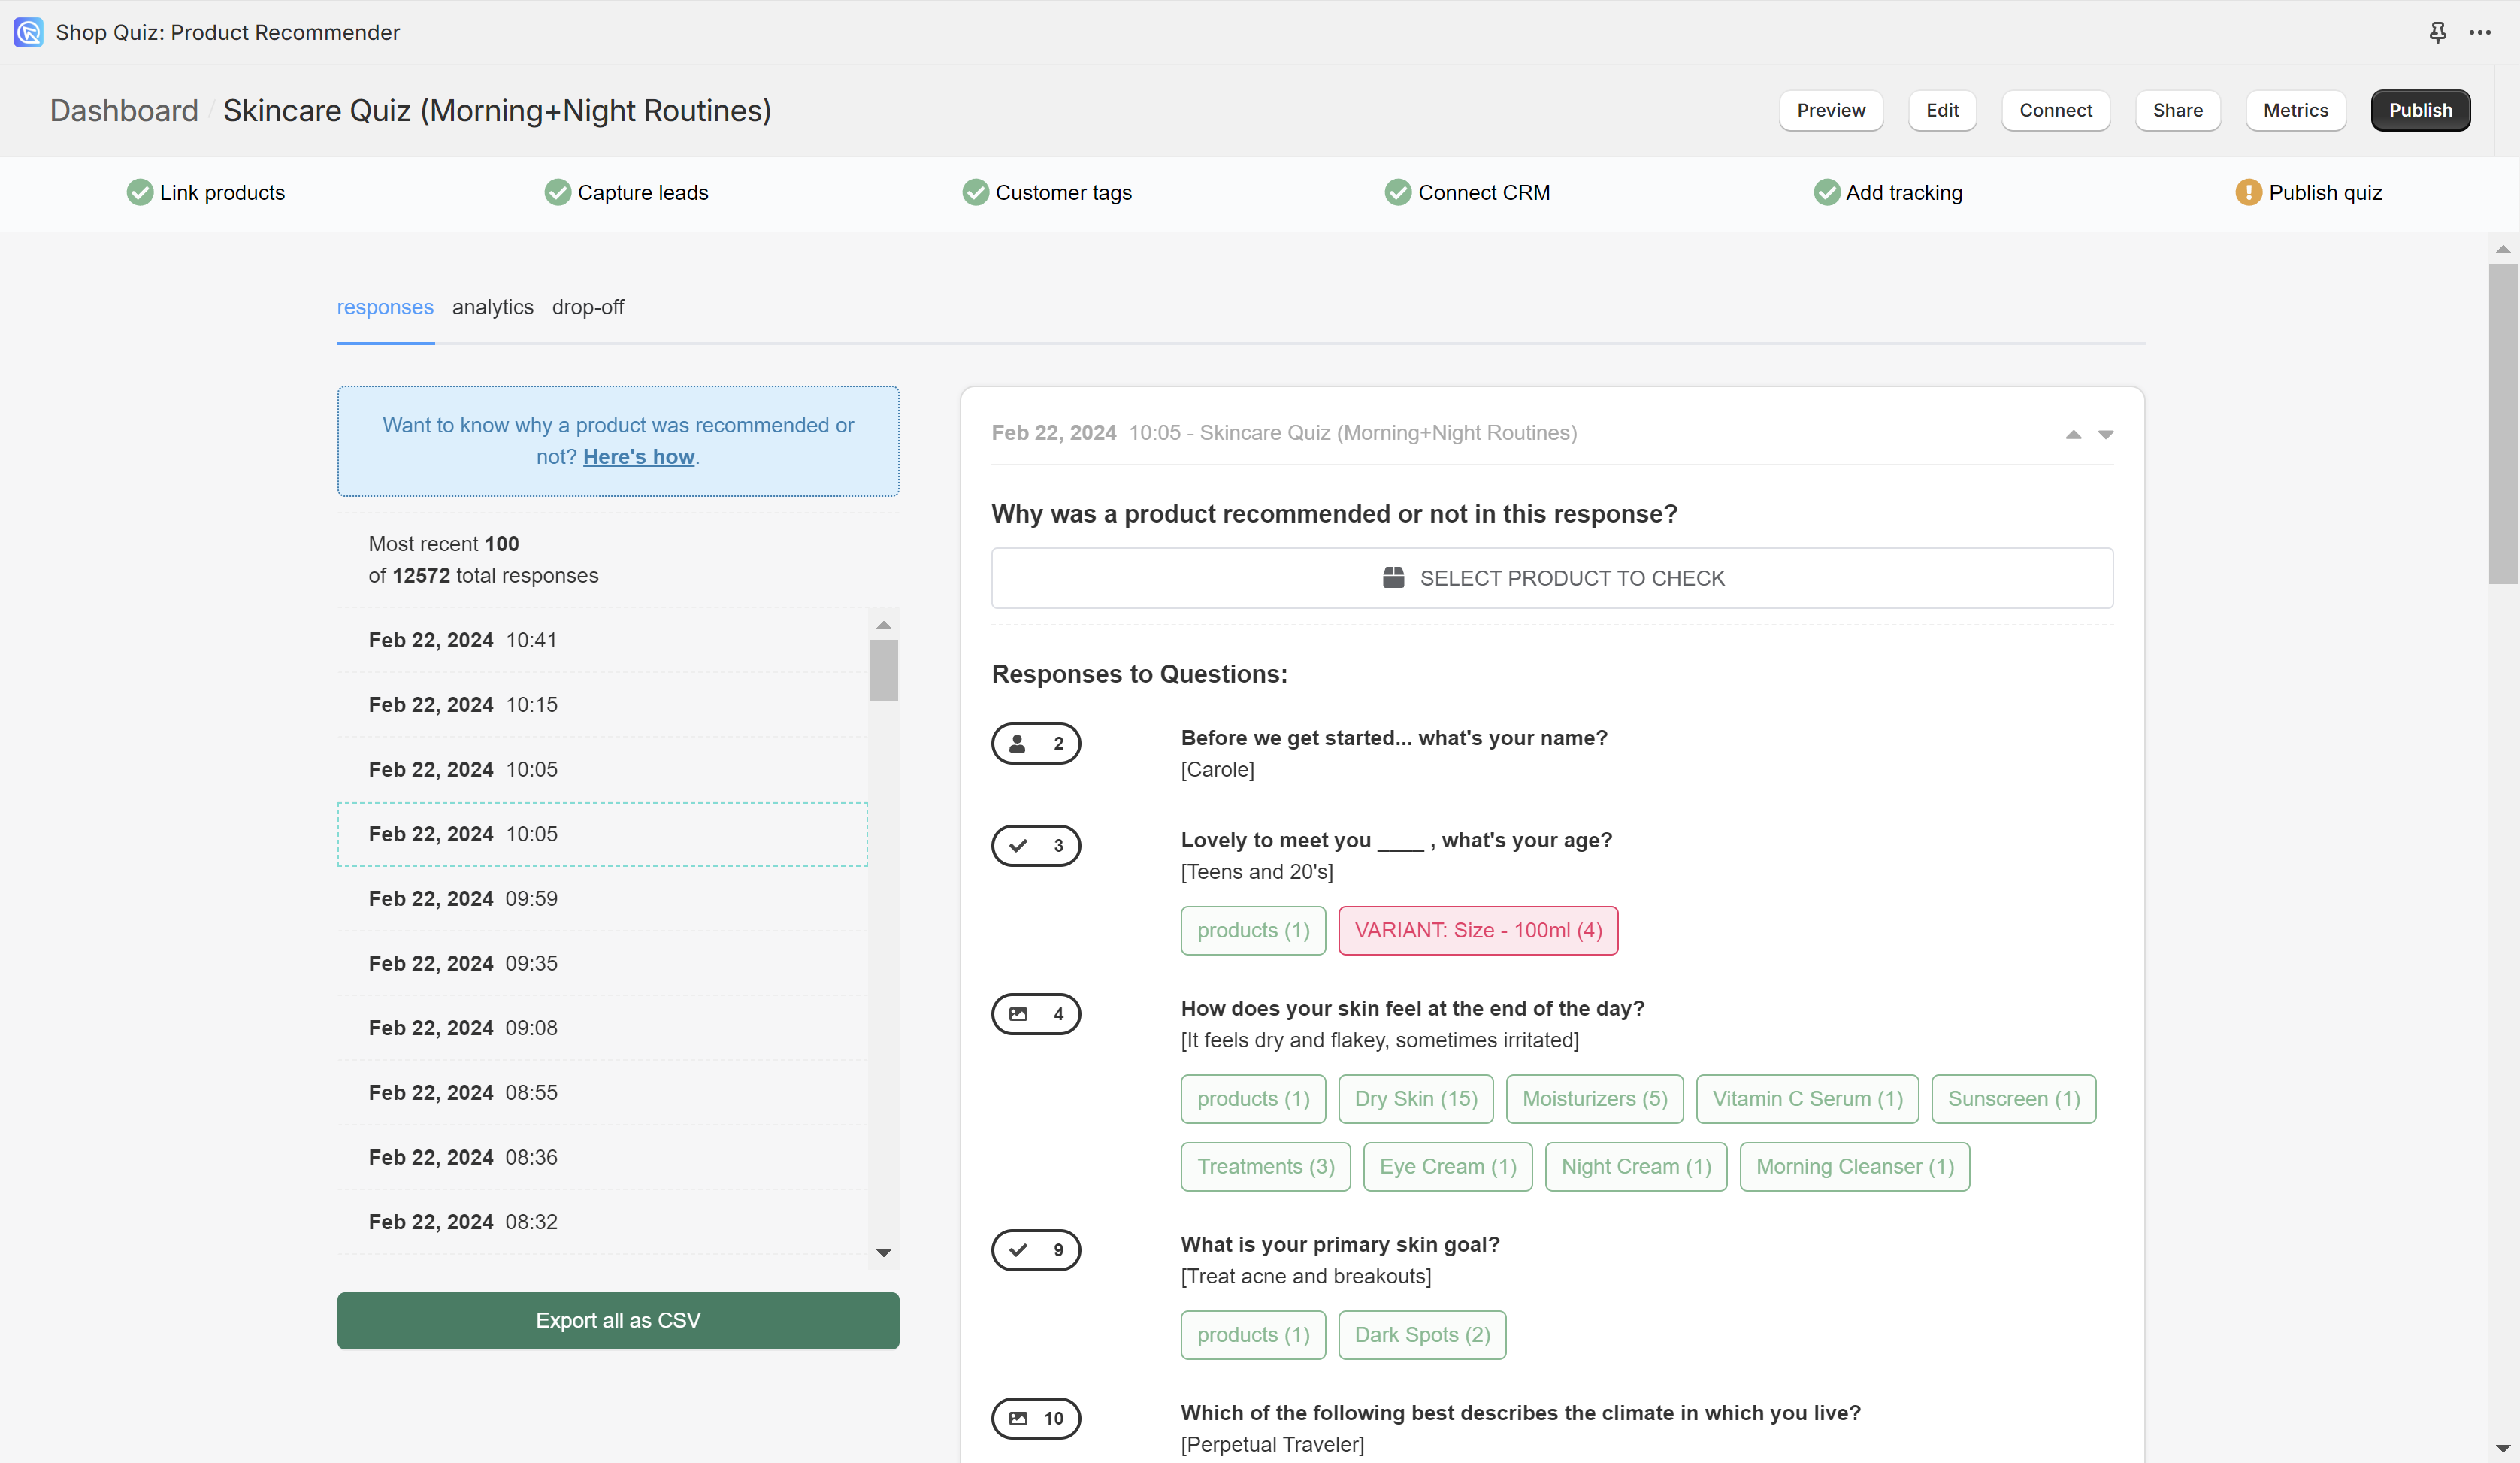
On the left-hand side menu, you will find the most recent 100 responses the quiz received organized by date/timestamp. Click on a date to open a specific response.
Export CSV - 1 month / Export CSV - 3 months / Export CSV - 6 months - Click to generate a CSV file with the quiz responses from the last 1, 3 or 6 months. Once ready, a downloadable link will show up on your dashboard.
Export size limit
Exports are capped at 100,000 responses. If the range you picked contains more than that, the export stops and you are asked to choose a shorter range. Contact support if you need a larger export.
Requesting another export
Once an export has finished, you can request a new one straight away, even if the download link from the previous export is still available.
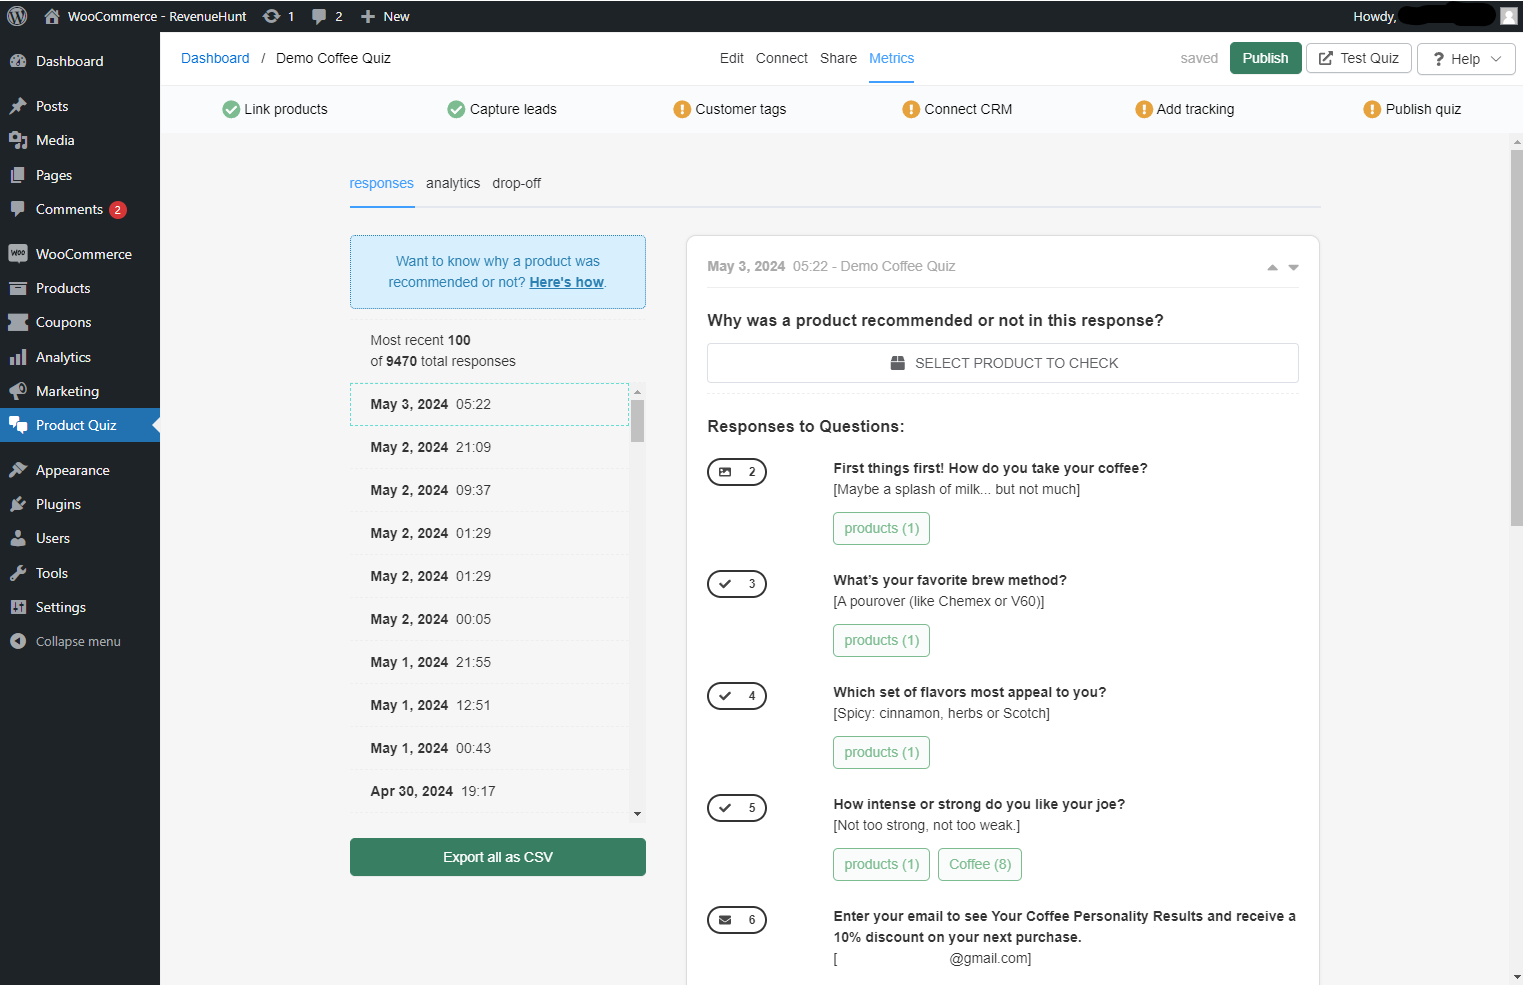
On the left-hand side menu, you will find the most recent 100 responses the quiz received organized by date/timestamp. Click on a date to open a specific response.
Export all as CSV - Click to generate a CSV file with all the quiz responses from the last 90 days. Once ready, a downloadable link will show up on your dashboard once the CSV file is finished generating.
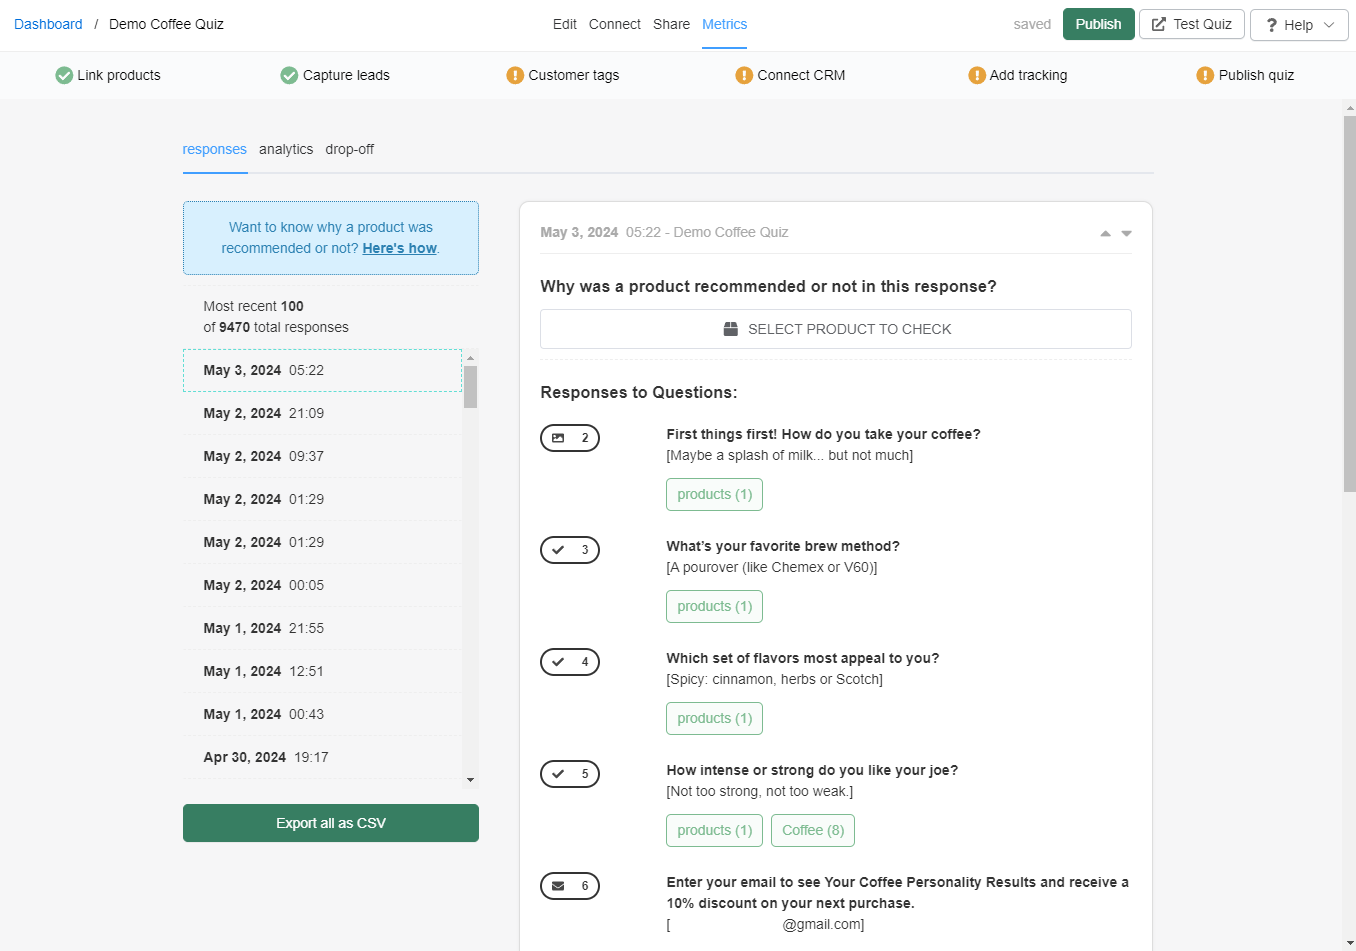
On the left-hand side menu, you will find the most recent 100 responses the quiz received organized by date/timestamp. Click on a date to open a specific response.
Export all as CSV - Click to generate a CSV file with all the quiz responses from the last 90 days. Once ready, a downloadable link will show up on your dashboard once the CSV file is finished generating.
On the left-hand side menu, you will find the most recent 100 responses the quiz received organized by date/timestamp. Click on a date to open a specific response.
Export all as CSV - Click to generate a CSV file with all the quiz responses from the last 90 days. Once ready, a downloadable link will show up on your dashboard once the CSV file is finished generating.
On the left-hand side menu, you will find the most recent 100 responses the quiz received organized by date/timestamp. Click on a date to open a specific response.
Export all as CSV - Click to generate a CSV file with all the quiz responses from the last 90 days. Once ready, a downloadable link will show up on your dashboard once the CSV file is finished generating.
Response analysis
Each response analysis page displays the following sections:
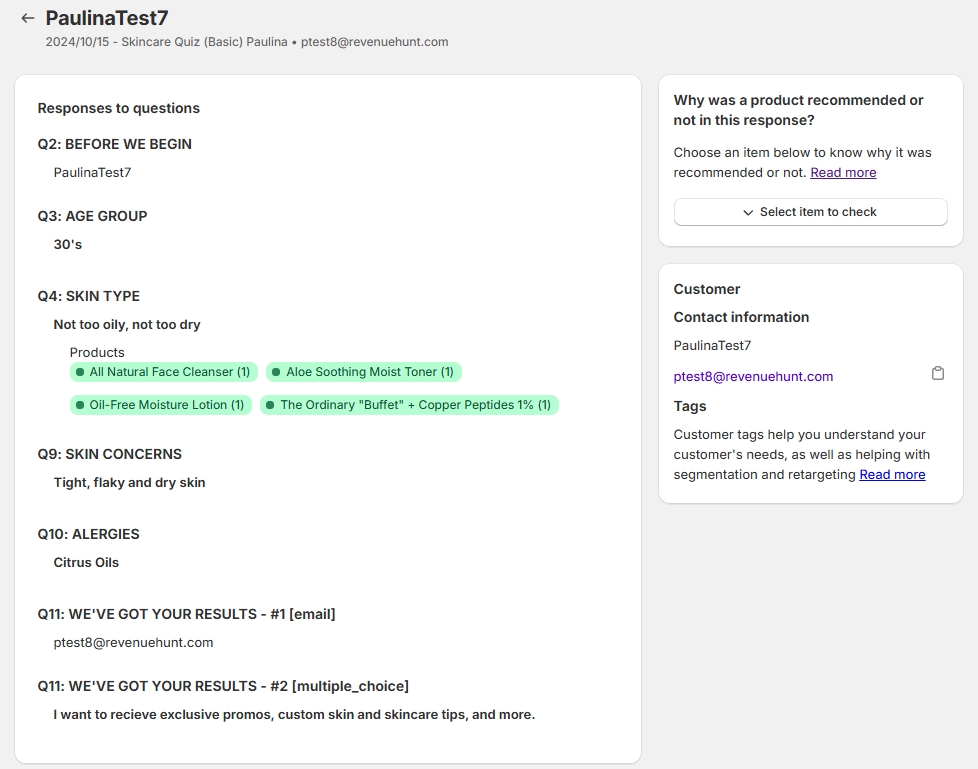
Analyze response - Click to open the Quiz Copilot chat window. The Copilot will ask you the following question: "I can help you analyze this quiz response. What seems to be the issue? You can select a common question below or type your own." Reply, and the Copilot analyses the response. It identifies the root cause and suggests improvements.
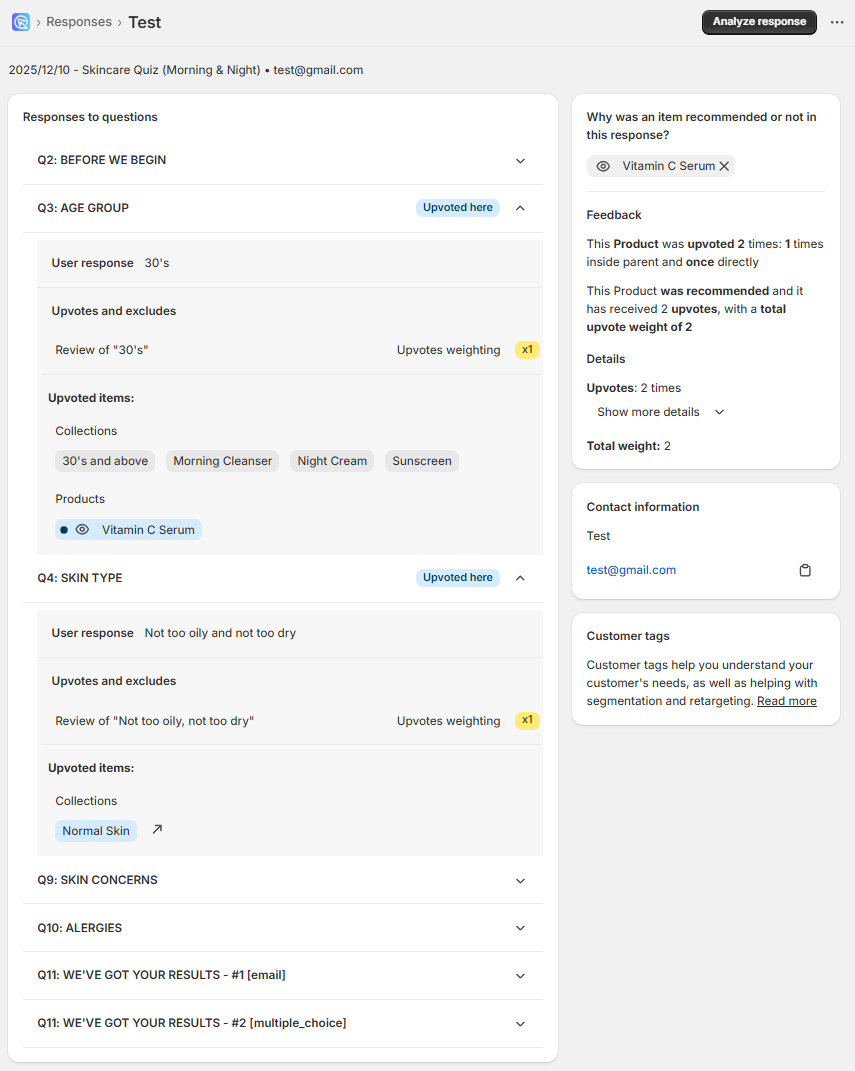
Responses to questions - Displays all the quiz questions, the answers the customer provided and the products/collections that were upvoted or excluded in each question. Click ▼ on a question to expand it and check the details.
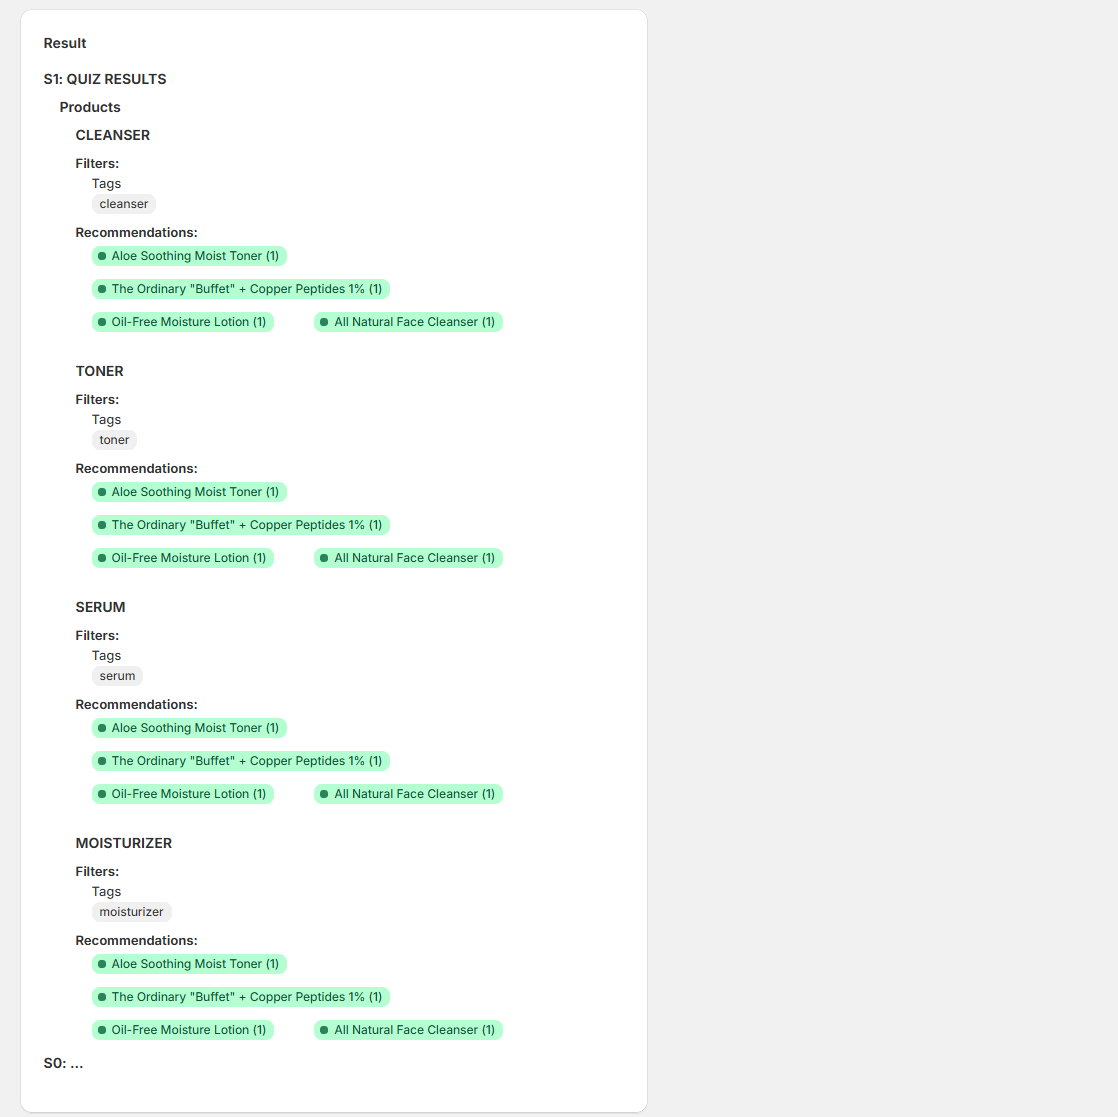
Additional captured data
JavaScript-injected answers (data captured via custom JavaScript integrations) are displayed in a separate "Additional Captured Data" section within the response analysis. This makes it easy to identify and review any custom data that was programmatically added to the quiz response.
Why was a product recommended or not in this response? - Use this section to troubleshoot a single response. It shows why a product was recommended or left out.
v Select item to check - Click to select a product from the catalog and analyze it against the response. Choose an item below to know why it was recommended or not.
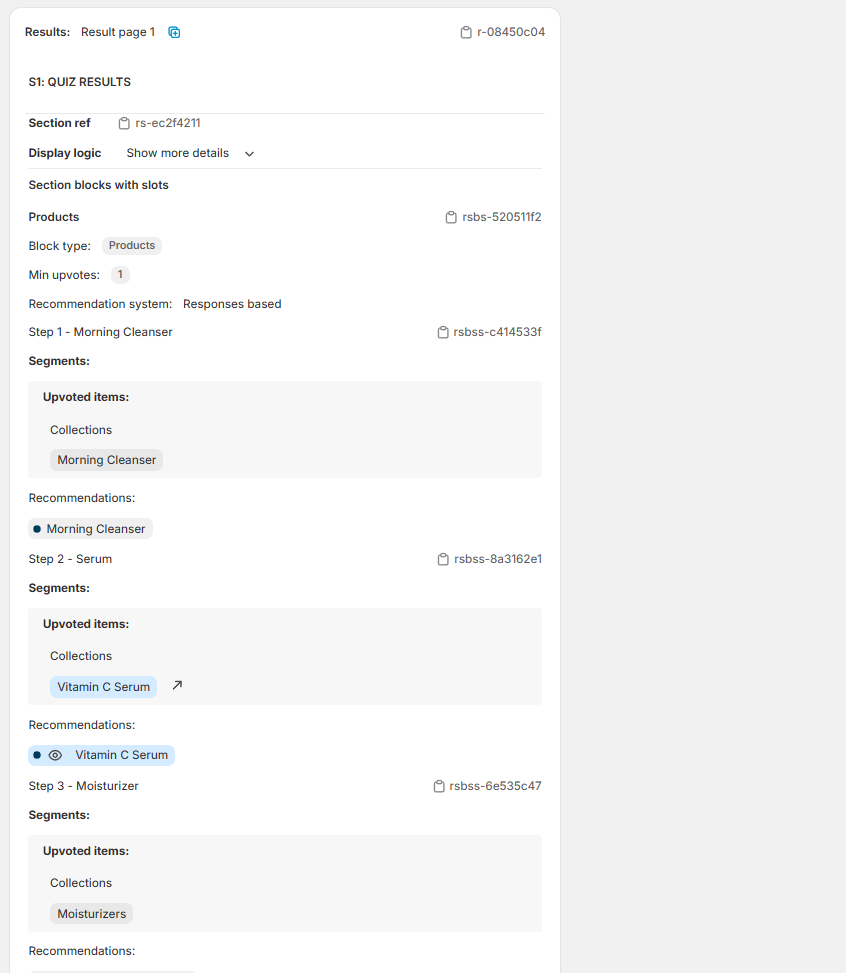
Contact information - Displays the contact information provided by the customer in the quiz such as name, email, phone number, etc.
Customer Tags - Displays the customer tags associated with this response. Customer tags help you understand your customer's needs, as well as helping with segmentation and retargeting.
Integrations - Displays the integrations that were triggered for this response and whether they were successful or not.
Result: Results page 1 - Displays the name of the results page recommended. This screen displays the configuration of a Result Section and explains what was shown to the customer and why.
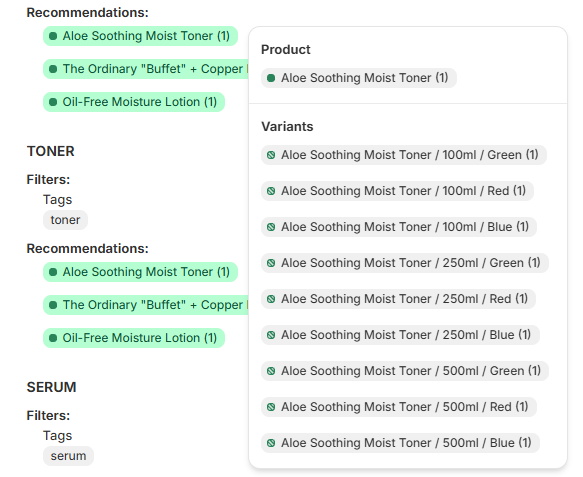
Section Overview
Section Title - Displays the name of the section recommended.
Section Ref - Internal reference used to identify the section.
Display logic
Show more details - click to expand the display logic section.
Default visibility - Visible or Hidden - The section explains if the section was shown or not.
Conditional Logic - This section explains if the section was shown based on the quiz logic.
Conclusion - Explains why the section was shown or hidden based on the quiz logic.
Section blocks with slots - Displays the blocks with slots in detail. Each section can include one or more blocks.
Block Ref - Internal reference used to identify the block.
Block Type - Products or Collections or Text - This block explains the block type.
Minimum Upvotes - The minimum number of upvotes a product must receive to be shown in the block.
Recommendation system - Fixed recommendations or Based on customer responses - This explains if the recommendations are fixed or dynamic.
Segments in Detail - Displays the segments in detail. Each block contains one or more segments, which define which products are shown and how they are selected:
Slot Ref - Internal reference used to identify the slot.
Upvoted items / Fixed Items - Explains that the recommendations are fixed in this slot and shows which products were selected.
Recommendations - The final products shown to the customer.
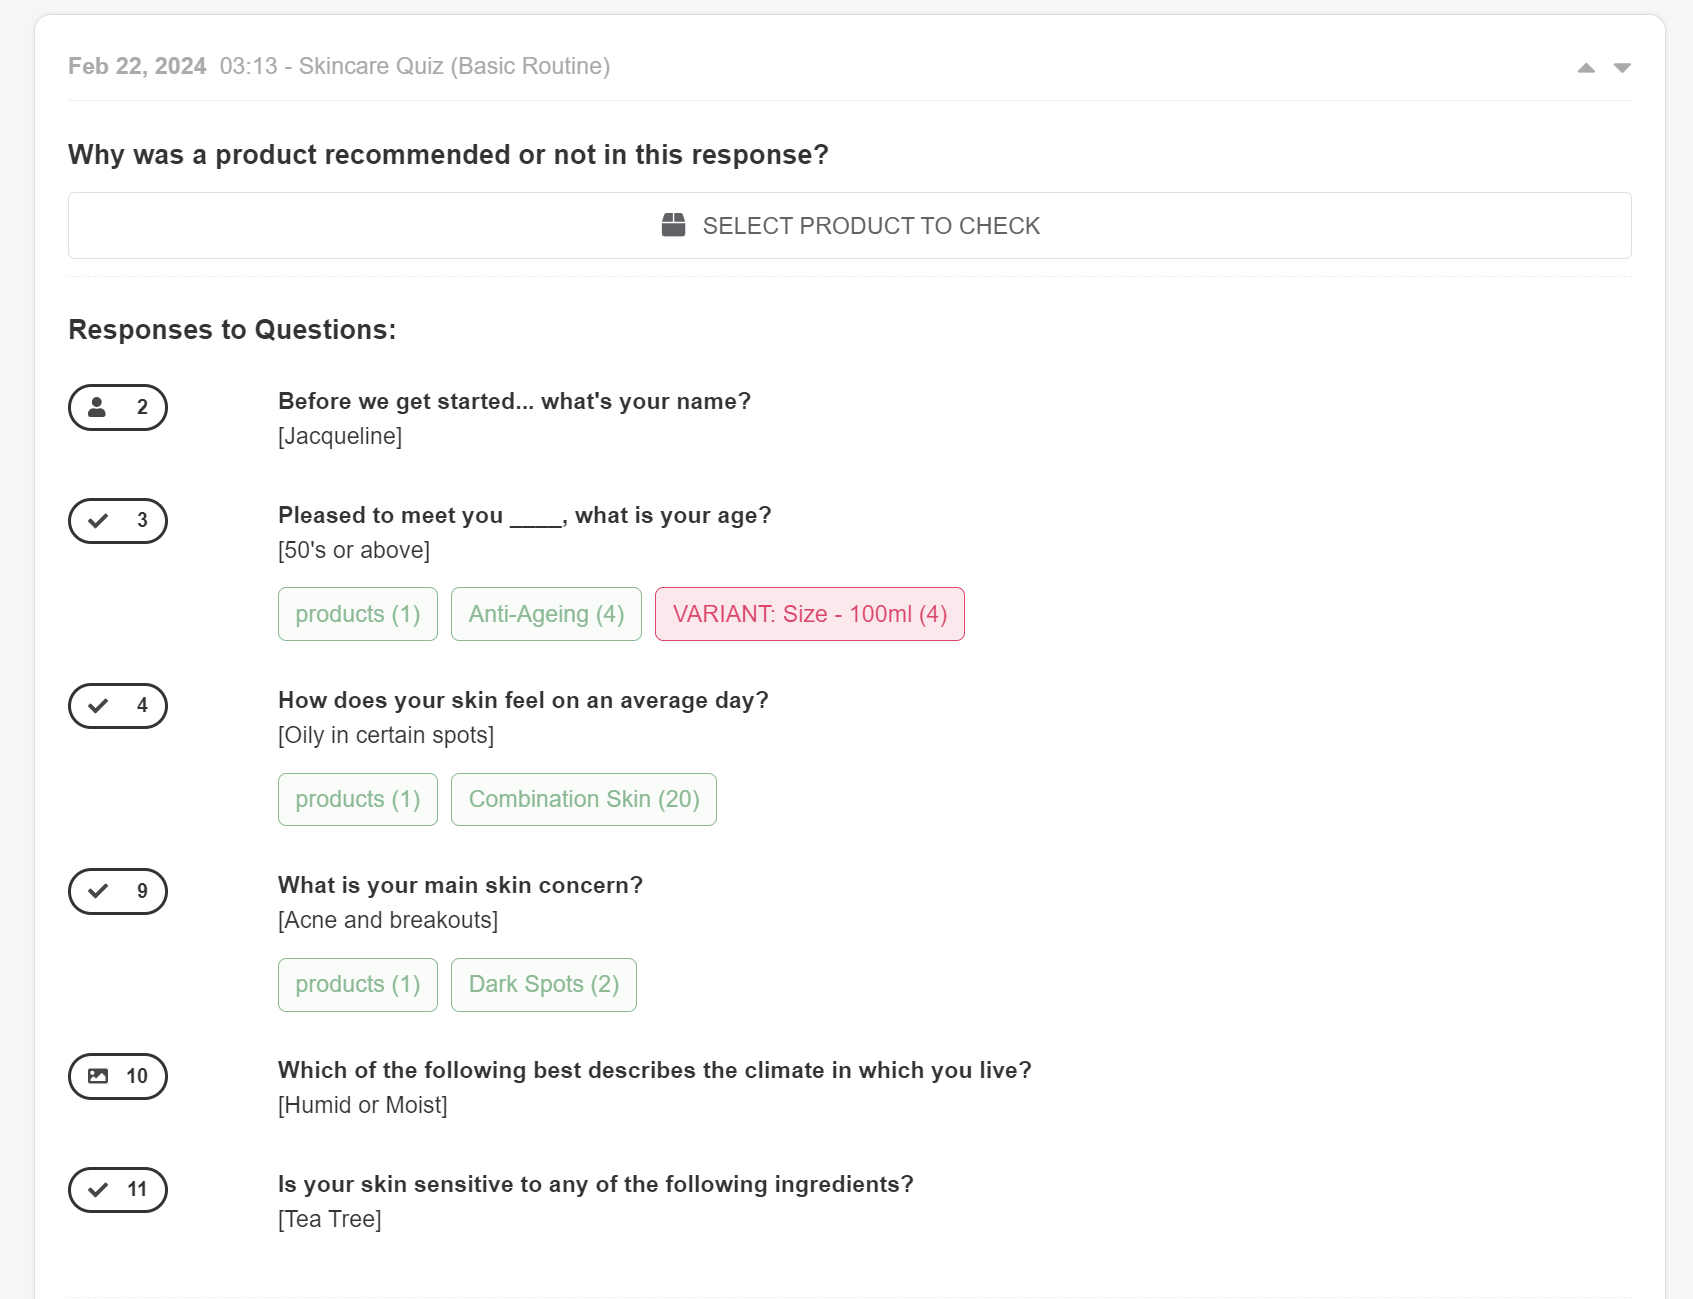
Why was a product recommended or not in this response? - Use this section to troubleshoot a single response, and to understand why a product was recommended or left out.
SELECT PRODUCT TO CHECK - Click to select a product from the catalog and analyze it against the response.
Responses to Questions - This section displays all the quiz questions, the answers the customer provided and the products/collections that were upvoted or excluded in each question.

Results Page 1 - Displays the name of the results page recommended.
Products - Products were recommended in a Product block.
↑1 🎁6 - Minimum votes for a product to show in this product block: 1. Maximum products shown in this product block: 6.
Kopi Luwak Coffee / Product name - Displays the name of the product recommended in this product block. Hover over the product to see how many upvotes it received in the quiz.
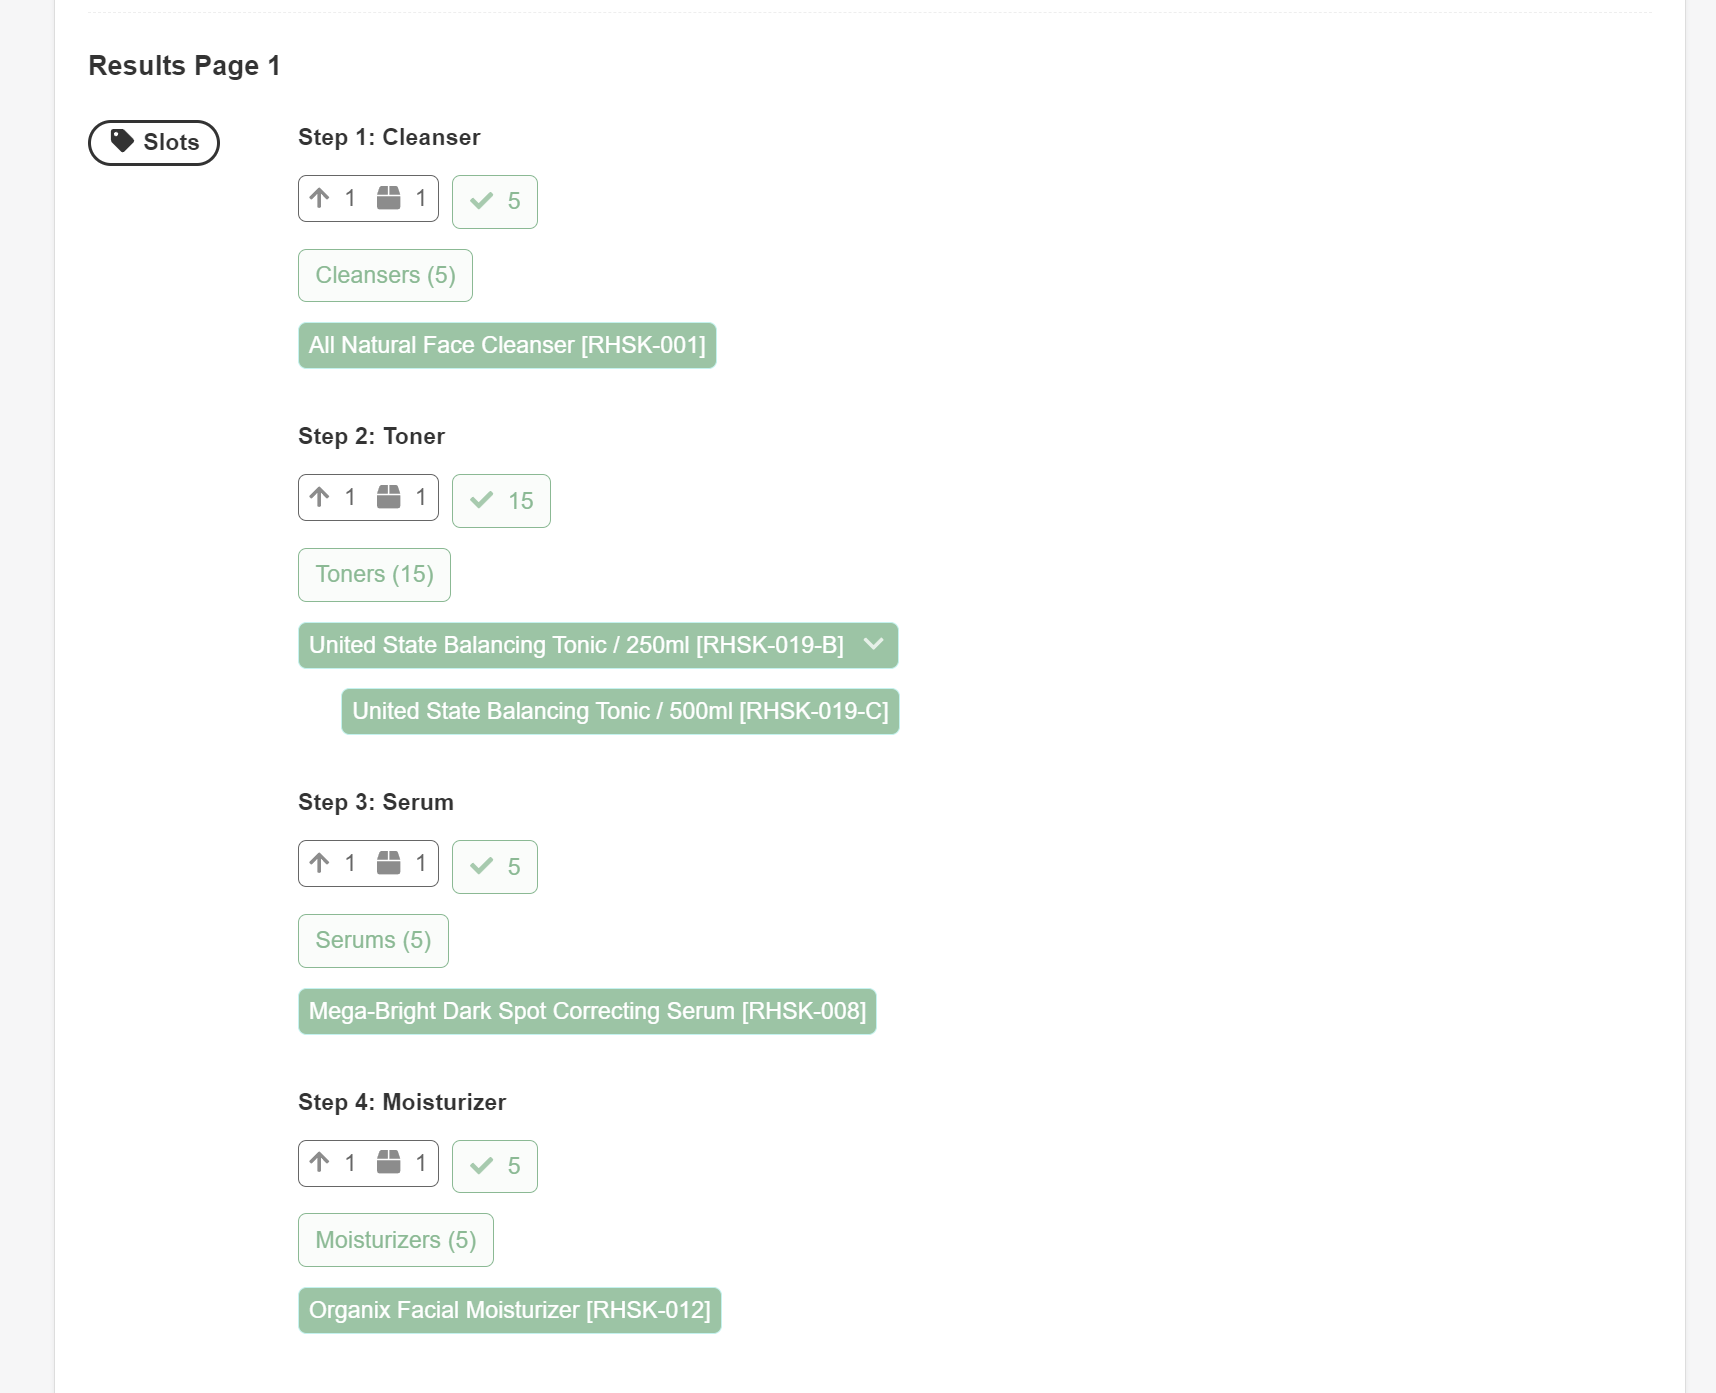
Results Page 1 - Displays the name of the results page recommended.
Slots - Products were recommended in a Slots block.
Step 1: Cleanser / Slot Title - Displays the title of the Slot block.
↑1 🎁1 - Minimum votes for a product to show in this slots block: 1. Maximum products shown in this slots block: 1.
✅5 - Displays which products this slot can show.
Cleansers (5) / Collection (x) - Displays the collections which are linked to this slot.
All Natural Face Cleanser - Displays the name of the product recommended in this slot block. Hover over the product to see how many upvotes it received in the quiz.
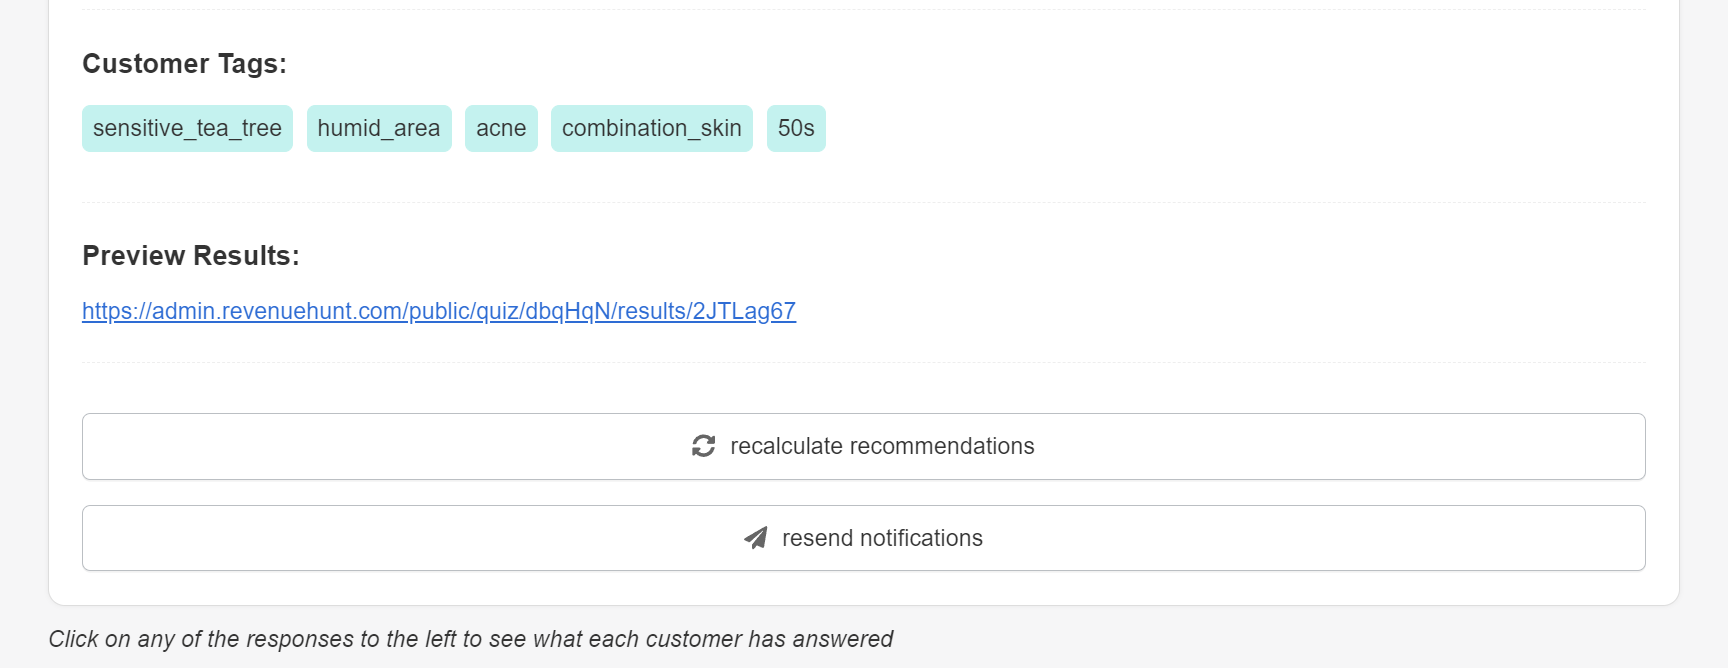
Customer Tags - Displays the customer tags that were recorded in this response.
Preview Results - Displays a preview link which opens this response on the results page.
recalculate recommendations - Recalculate the responses according to the current quiz setup.
resend notifications - Triggers the response again, which results in all the data being re-sent. This will cause the emails or data redirections to integrations to be triggered again.
Why was a product recommended or not in this response? - Use this section to troubleshoot a single response, and to understand why a product was recommended or left out.
SELECT PRODUCT TO CHECK - Click to select a product from the catalog and analyze it against the response.
Responses to Questions - This section displays all the quiz questions, the answers the customer provided and the products/collections that were upvoted or excluded in each question.
Results Page 1 - Displays the name of the results page recommended.
Products - Products were recommended in a Product block.
↑1 🎁6 - Minimum votes for a product to show in this product block: 1. Maximum products shown in this product block: 6.
Kopi Luwak Coffee / Product name - Displays the name of the product recommended in this product block. Hover over the product to see how many upvotes it received in the quiz.
Results Page 1 - Displays the name of the results page recommended.
Slots - Products were recommended in a Slots block.
Step 1: Cleanser / Slot Title - Displays the title of the Slot block.
↑1 🎁1 - Minimum votes for a product to show in this slots block: 1. Maximum products shown in this slots block: 1.
✅5 - Displays which products this slot can show.
Cleansers (5) / Collection (x) - Displays the collections which are linked to this slot.
All Natural Face Cleanser - Displays the name of the product recommended in this slot block. Hover over the product to see how many upvotes it received in the quiz.
Customer Tags - Displays the customer tags that were recorded in this response.
Preview Results - Displays a preview link which opens this response on the results page.
recalculate recommendations - Recalculate the responses according to the current quiz setup.
resend notifications - Triggers the response again, which results in all the data being re-sent. This will cause the emails or data redirections to integrations to be triggered again.
Why was a product recommended or not in this response? - Use this section to troubleshoot a single response, and to understand why a product was recommended or left out.
SELECT PRODUCT TO CHECK - Click to select a product from the catalog and analyze it against the response.
Responses to Questions - This section displays all the quiz questions, the answers the customer provided and the products/collections that were upvoted or excluded in each question.
Results Page 1 - Displays the name of the results page recommended.
Products - Products were recommended in a Product block.
↑1 🎁6 - Minimum votes for a product to show in this product block: 1. Maximum products shown in this product block: 6.
Kopi Luwak Coffee / Product name - Displays the name of the product recommended in this product block. Hover over the product to see how many upvotes it received in the quiz.
Results Page 1 - Displays the name of the results page recommended.
Slots - Products were recommended in a Slots block.
Step 1: Cleanser / Slot Title - Displays the title of the Slot block.
↑1 🎁1 - Minimum votes for a product to show in this slots block: 1. Maximum products shown in this slots block: 1.
✅5 - Displays which products this slot can show.
Cleansers (5) / Collection (x) - Displays the collections which are linked to this slot.
All Natural Face Cleanser - Displays the name of the product recommended in this slot block. Hover over the product to see how many upvotes it received in the quiz.
Customer Tags - Displays the customer tags that were recorded in this response.
Preview Results - Displays a preview link which opens this response on the results page.
recalculate recommendations - Recalculate the responses according to the current quiz setup.
resend notifications - Triggers the response again, which results in all the data being re-sent. This will cause the emails or data redirections to integrations to be triggered again.
Why was a product recommended or not in this response? - Use this section to troubleshoot a single response, and to understand why a product was recommended or left out.
SELECT PRODUCT TO CHECK - Click to select a product from the catalog and analyze it against the response.
Responses to Questions - This section displays all the quiz questions, the answers the customer provided and the products/collections that were upvoted or excluded in each question.
Results Page 1 - Displays the name of the results page recommended.
Products - Products were recommended in a Product block.
↑1 🎁6 - Minimum votes for a product to show in this product block: 1. Maximum products shown in this product block: 6.
Kopi Luwak Coffee / Product name - Displays the name of the product recommended in this product block. Hover over the product to see how many upvotes it received in the quiz.
Results Page 1 - Displays the name of the results page recommended.
Slots - Products were recommended in a Slots block.
Step 1: Cleanser / Slot Title - Displays the title of the Slot block.
↑1 🎁1 - Minimum votes for a product to show in this slots block: 1. Maximum products shown in this slots block: 1.
✅5 - Displays which products this slot can show.
Cleansers (5) / Collection (x) - Displays the collections which are linked to this slot.
All Natural Face Cleanser - Displays the name of the product recommended in this slot block. Hover over the product to see how many upvotes it received in the quiz.
Customer Tags - Displays the customer tags that were recorded in this response.
Preview Results - Displays a preview link which opens this response on the results page.
recalculate recommendations - Recalculate the responses according to the current quiz setup.
resend notifications - Triggers the response again, which results in all the data being re-sent. This will cause the emails or data redirections to integrations to be triggered again.
Why was a product recommended or not in this response? - Use this section to troubleshoot a single response, and to understand why a product was recommended or left out.
SELECT PRODUCT TO CHECK - Click to select a product from the catalog and analyze it against the response.
Responses to Questions - This section displays all the quiz questions, the answers the customer provided and the products/collections that were upvoted or excluded in each question.
Results Page 1 - Displays the name of the results page recommended.
Products - Products were recommended in a Product block.
↑1 🎁6 - Minimum votes for a product to show in this product block: 1. Maximum products shown in this product block: 6.
Kopi Luwak Coffee / Product name - Displays the name of the product recommended in this product block. Hover over the product to see how many upvotes it received in the quiz.
Results Page 1 - Displays the name of the results page recommended.
Slots - Products were recommended in a Slots block.
Step 1: Cleanser / Slot Title - Displays the title of the Slot block.
↑1 🎁1 - Minimum votes for a product to show in this slots block: 1. Maximum products shown in this slots block: 1.
✅5 - Displays which products this slot can show.
Cleansers (5) / Collection (x) - Displays the collections which are linked to this slot.
All Natural Face Cleanser - Displays the name of the product recommended in this slot block. Hover over the product to see how many upvotes it received in the quiz.
Customer Tags - Displays the customer tags that were recorded in this response.
Preview Results - Displays a preview link which opens this response on the results page.
recalculate recommendations - Recalculate the responses according to the current quiz setup.
resend notifications - Triggers the response again, which results in all the data being re-sent. This will cause the emails or data redirections to integrations to be triggered again.
Analytics
Access the Analytics from the Dashboard. You can open the Analytics tab from the Shopify side menu.
or pick a quiz, click ... to open the quiz menu, then click Analytics.
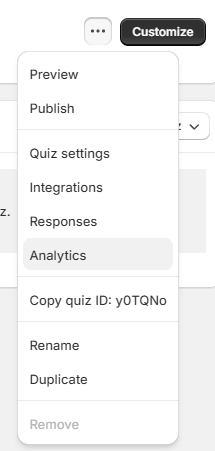
The Analytics tab will open with the data for the selected quiz.
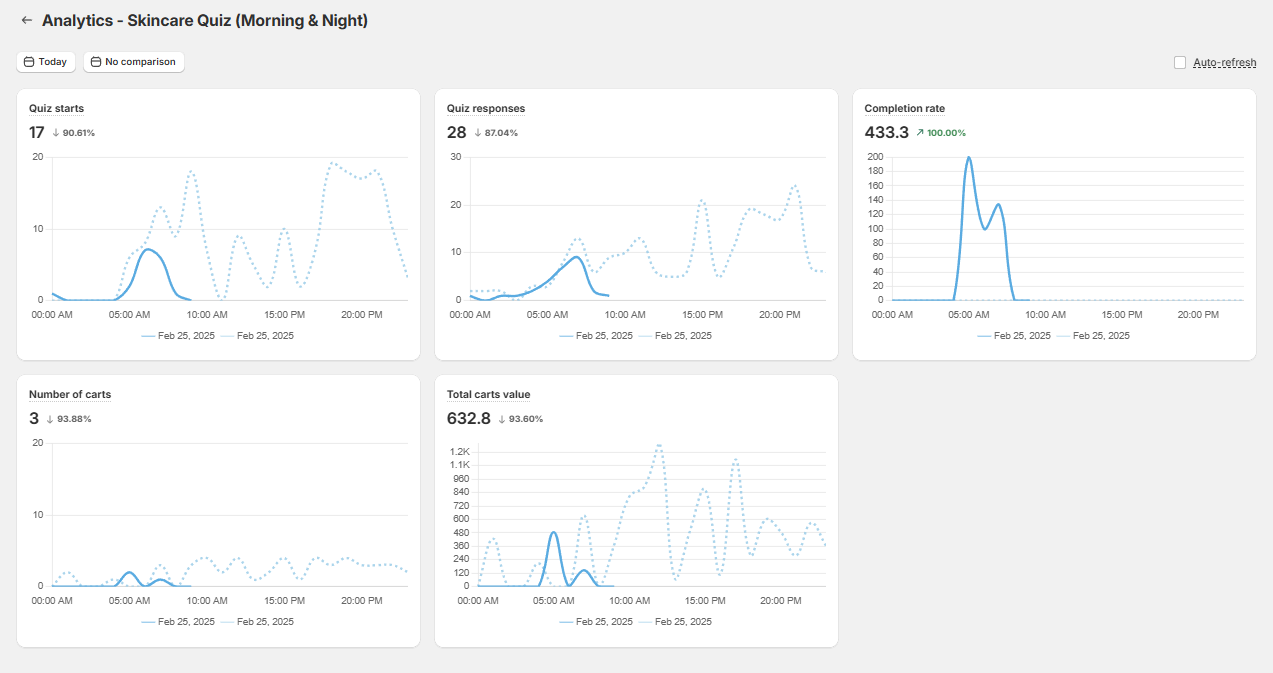
The data in the graphs are totals in a selected period of time for a selected quiz.
Click the Quiz name to change the quiz.
Today / Last 90 days - To change the dates click on the Today/ Last 90 days button. You can change the period to select it from the moment you started using the quiz or from a given date.
No comparison - Choose how you want to compare the data in the graphs.
Customize- Click to add new cards to your analytics dashboard or re-arrange the cards.
Data refresh frequency
The analytics dashboard updates at different intervals, depending on the type of data:
-
Quiz responses and Engagement Data (e.g. responses, section visibility, results page distribution) → Updated live for recent activity (today/yesterday) and refreshed automatically every ~5 minutes for cached data over longer ranges.
-
Orders and Revenue Data → Synced with Shopify once per day to ensure accuracy with your store’s order information.
If you have just received new responses, allow a few minutes for them to appear in all analytics cards.
DEFAULT ANALYTICS CARDS
By default you see five blocks with the following metrics:
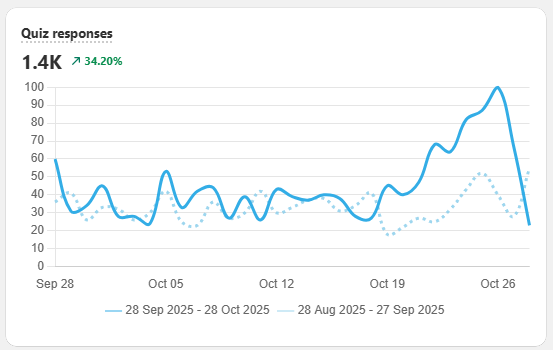
Quiz Responses - Number of people who have completed the quiz. Test responses (completed via the Test quiz button) are deleted from your metrics after one hour. 1.4K - number of responses received in a specified period (in black). ↗34.20% - growth compared to last period (in green).
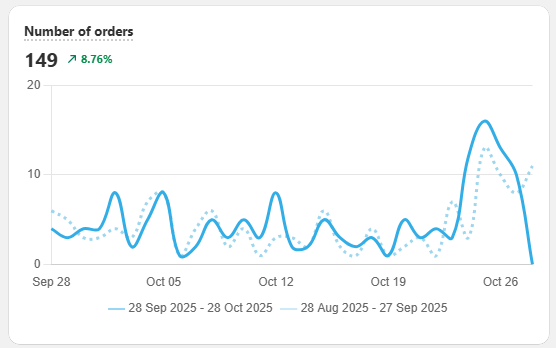
Number of orders - Number of people who have placed an order after completing this quiz. 149 - number of orders received in a specified period (in black). ↗8.76% - growth compared to last period (in green).
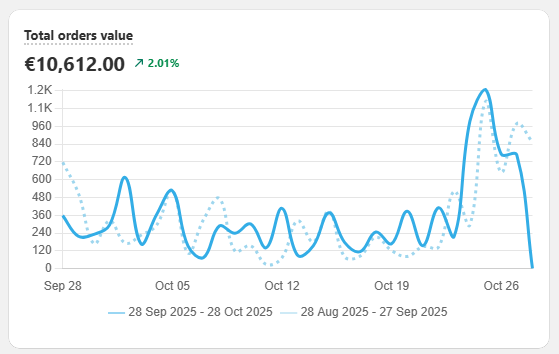
Total orders value - Total value of orders placed after taking this quiz. €10,612.00 - total value of orders in a specified period (in black). ↗2.01% - growth compared to last period (in green).
Tracking order values
To track order values, connect your quiz to Shopify Customers in App settings.
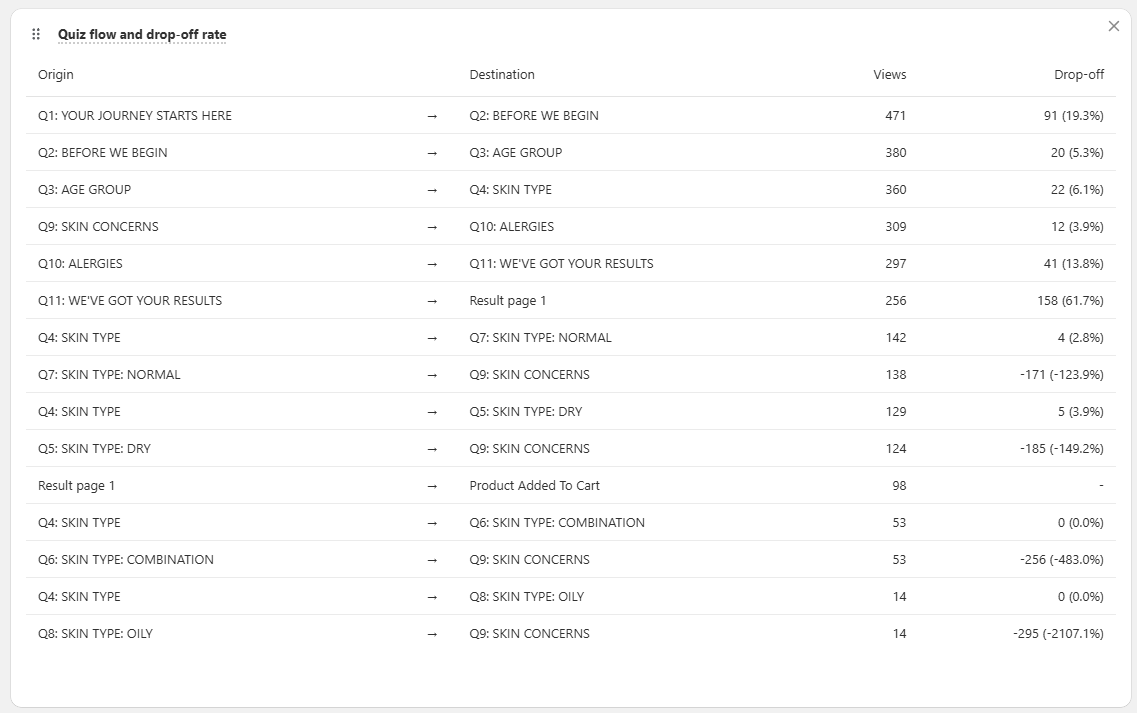
Drop-off rate - Counts of key funnel events captured during the selected period, and the drop-off rate for each step. This table shows how customers move through your quiz, from the first question to the results and checkout, and where they drop off. Origin - The slide or question where customers started a step. Destination - The next slide or page they reached. Views - How many times this transition happened in the selected range. Share of Step - The percentage of customers who left the quiz instead of continuing. Outcome - Continued or Exited.
Tip
A high drop-off rate may indicate confusion, friction, or lack of engagement at that step. Try simplifying the question, reducing required inputs, or improving the design and copy to keep customers moving forward.
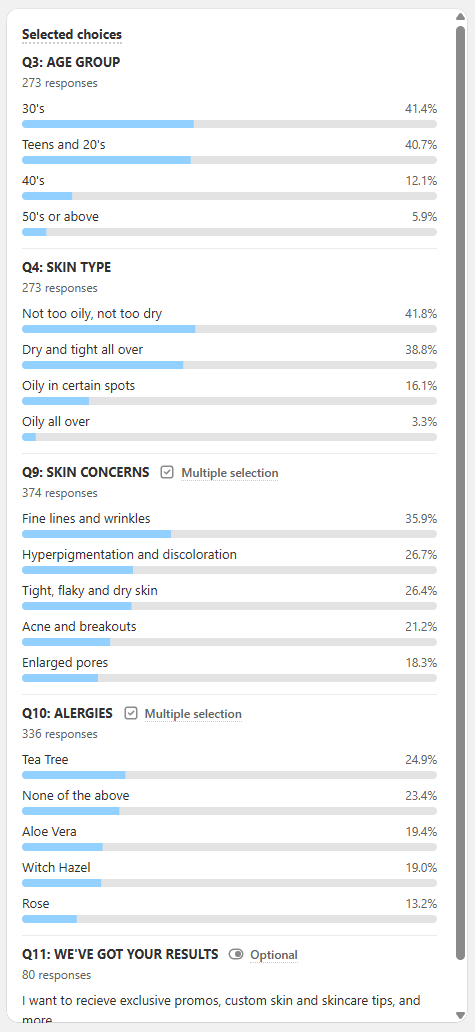
Selected choices - See which choices are selected most for each question. It shows how customers answered each question, so you can see the most popular options. Single-choice questions display the percentage of customers who selected each answer. Multiple-choice questions (marked with Multiple selection) show how often each option was chosen across all responses. Optional questions only include data from customers who reached and answered that question.
Example
In Q3: AGE GROUP, from 273 responses, 41.4% of 273 selected 30's choice, 40.7% of 273 selected Teens and 20's, 12.1% of 273 selected 40's and 5.9% of 273 selected 50's and above.
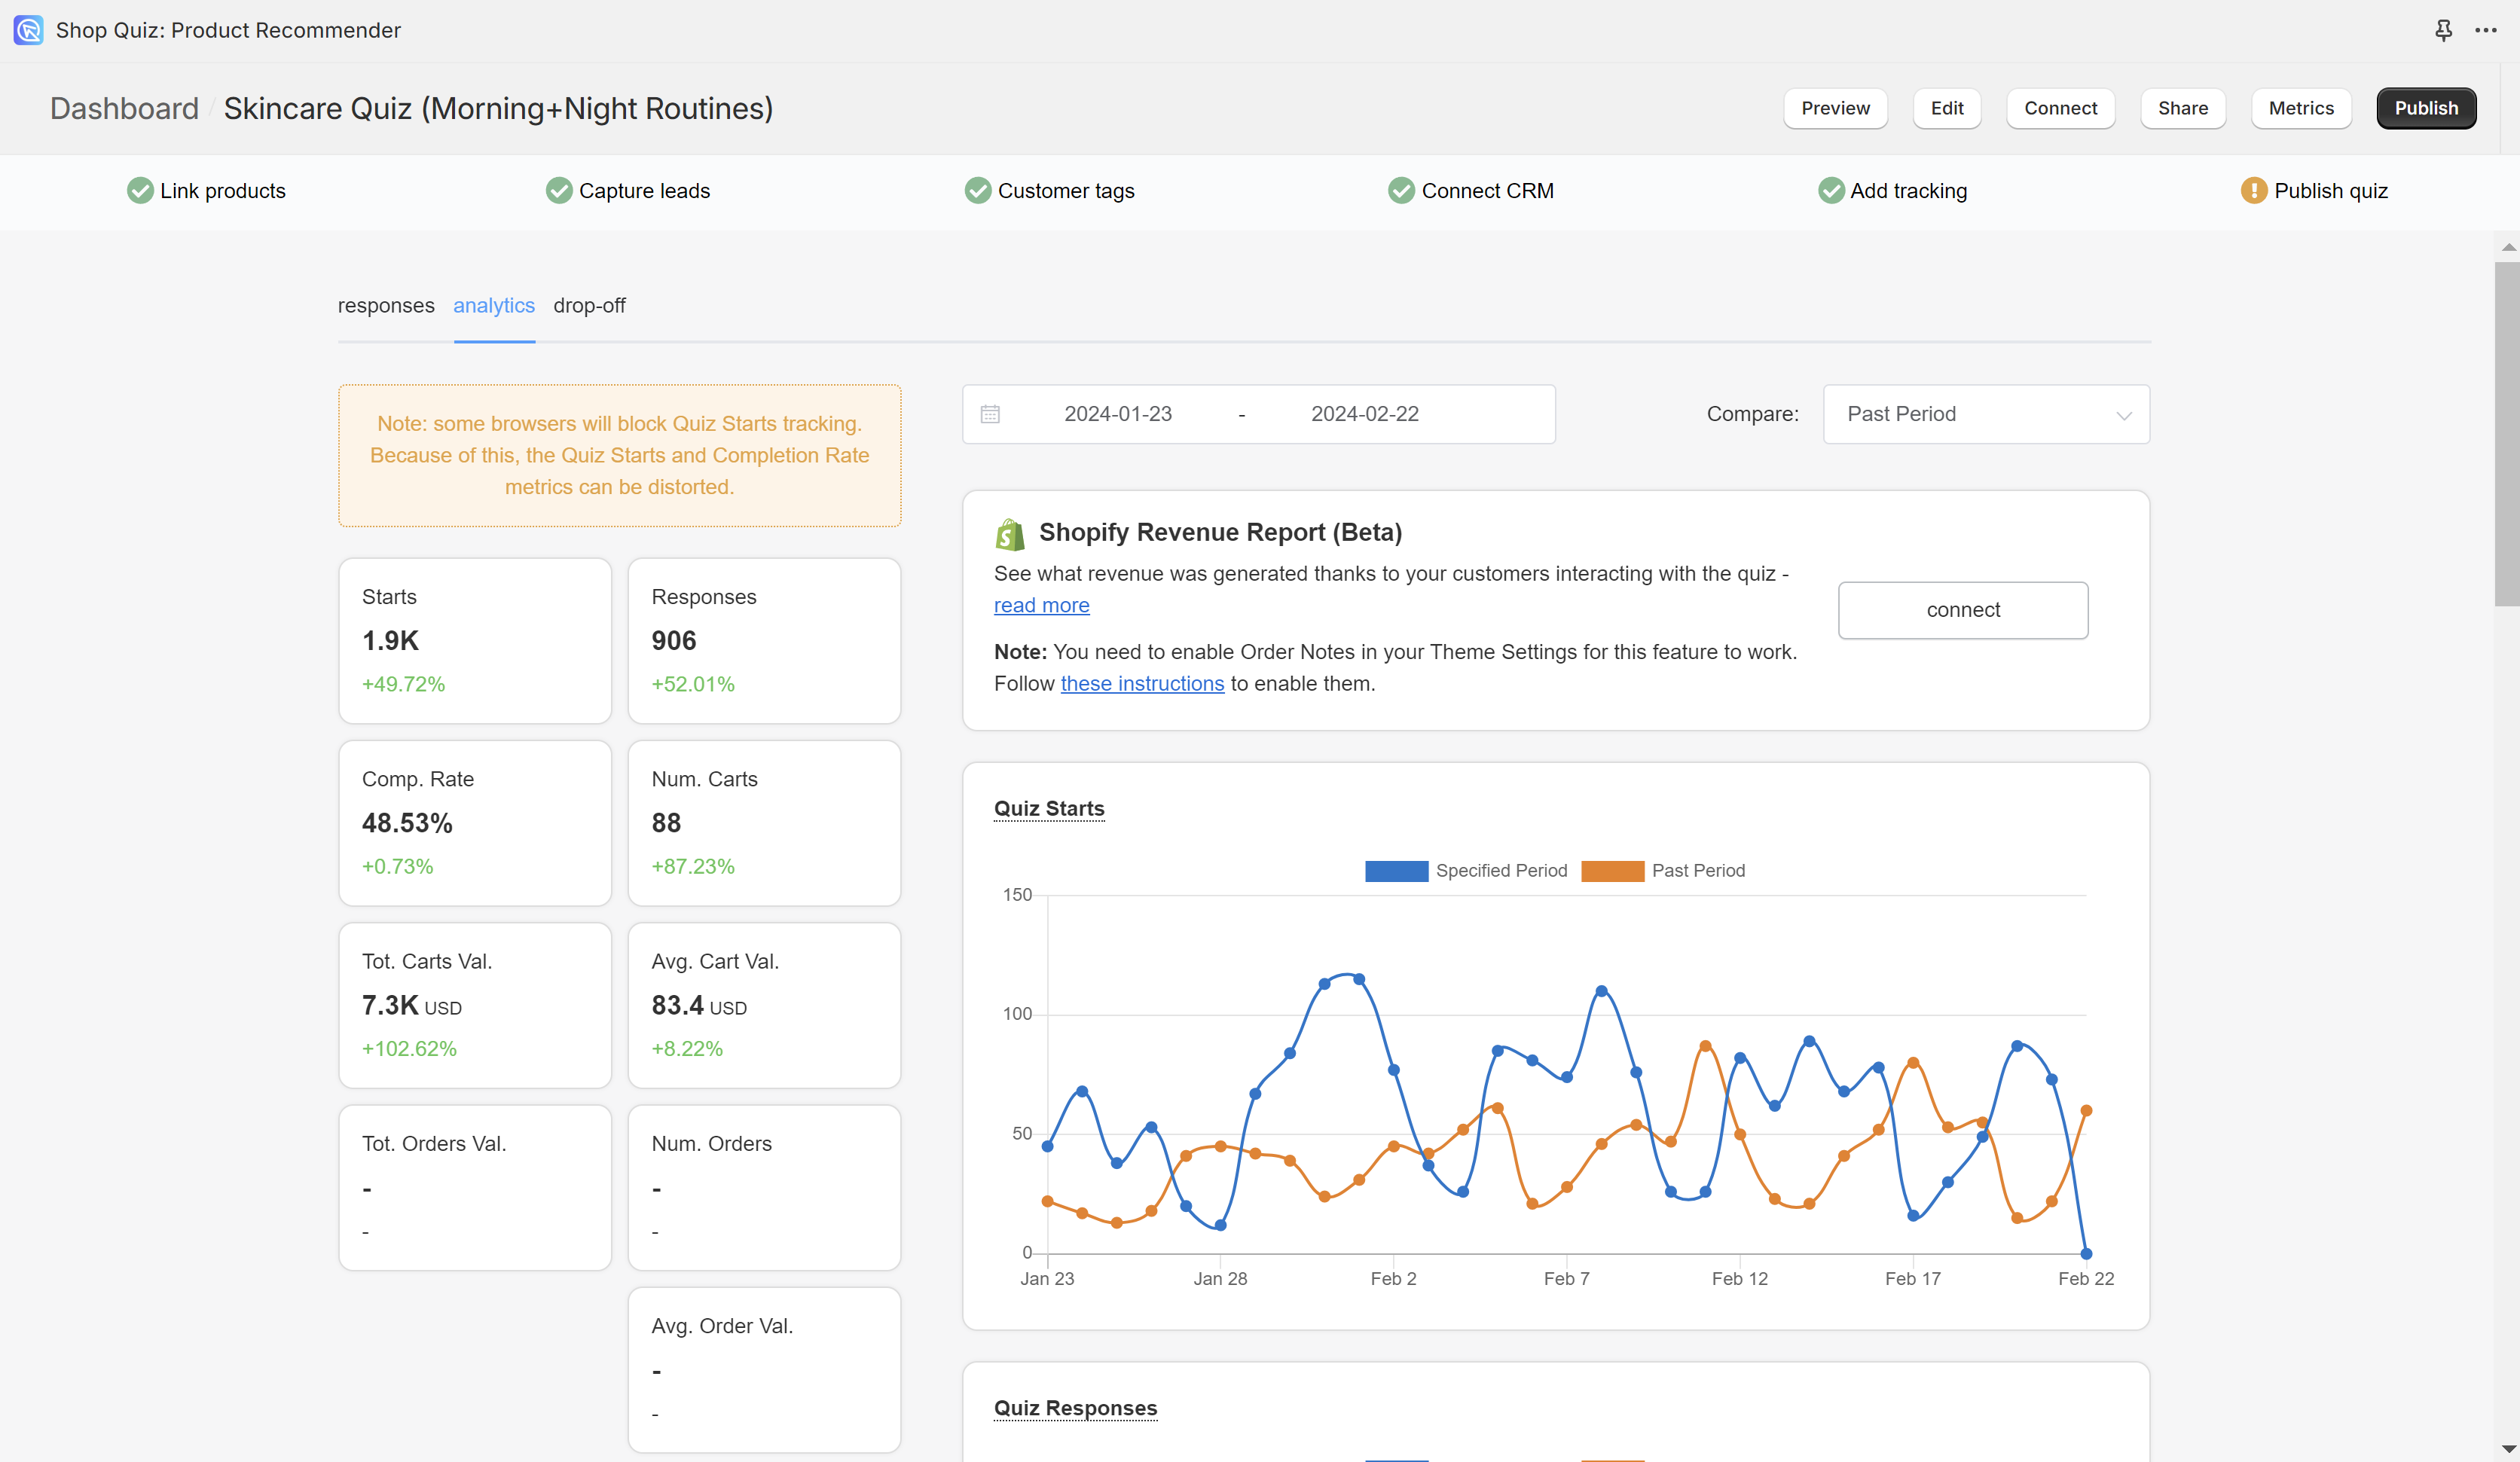
The data in the graphs are totals in a selected period of time for a selected quiz.

To change the dates click on the 📆 icon. You can change the period to select it from the moment you started using the quiz or from a given date.
Compare: - Choose how you want to compare the data in the graphs.
Part Period - Presents data against the values from previous 30 days.
Quiz - Choose a quiz name against which you want to compare the metrics against.
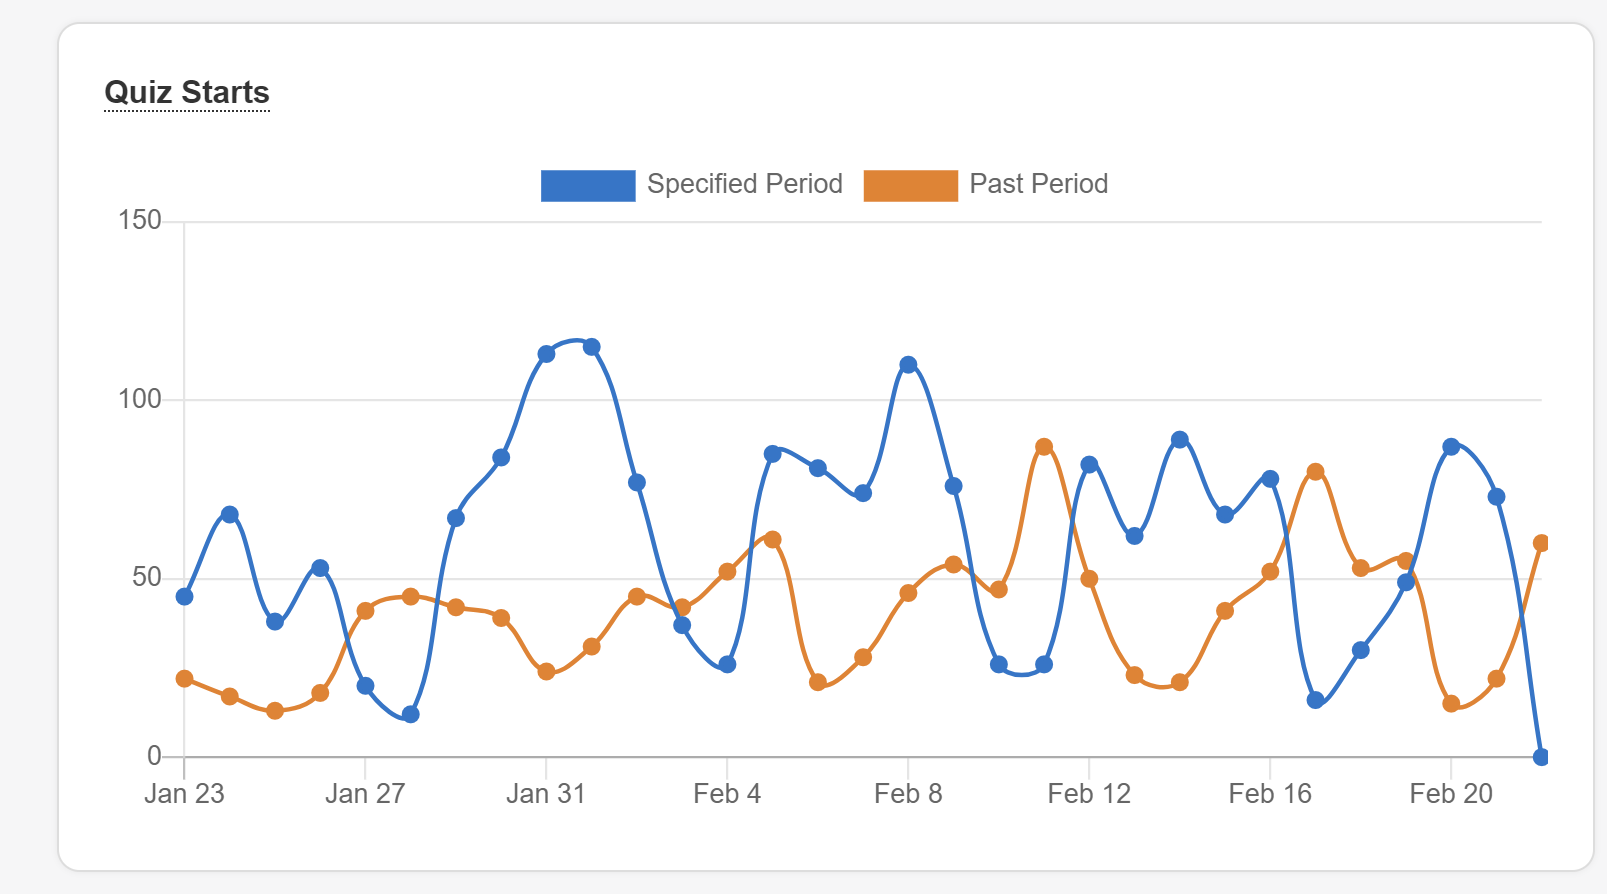
Quiz Starts / Starts - Number of people who engaged with the quiz and passed the first slide. That is, they clicked start quiz or answered the first question.
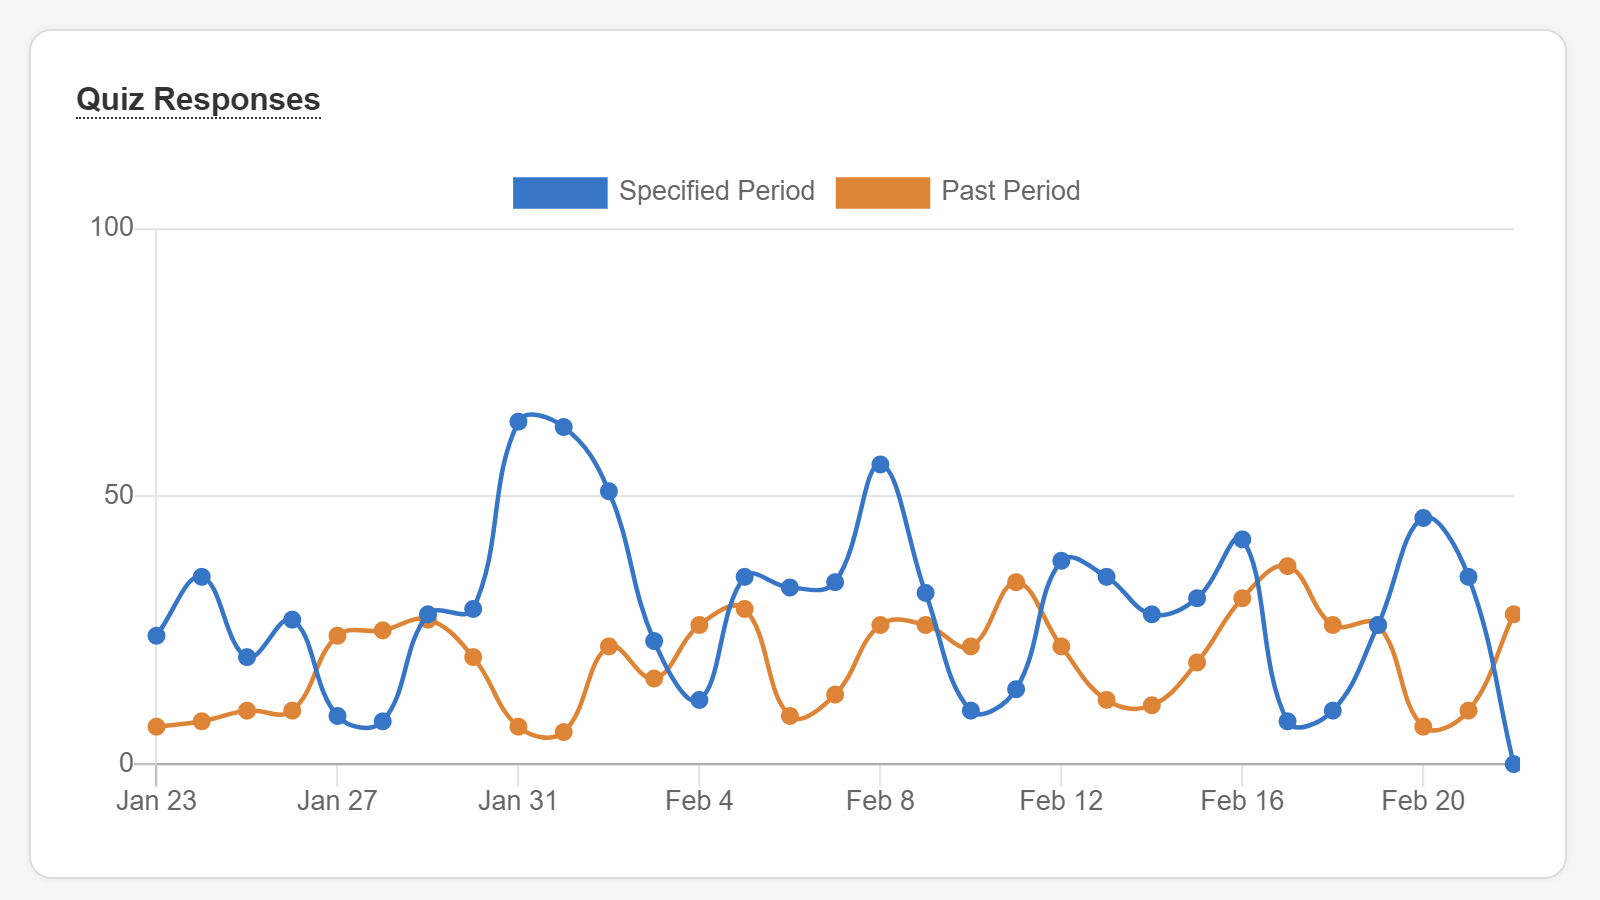
Quiz Responses / Responses - Number of people who have completed the quiz. Test responses (completed via the Test quiz button) are deleted from your metrics after one hour.
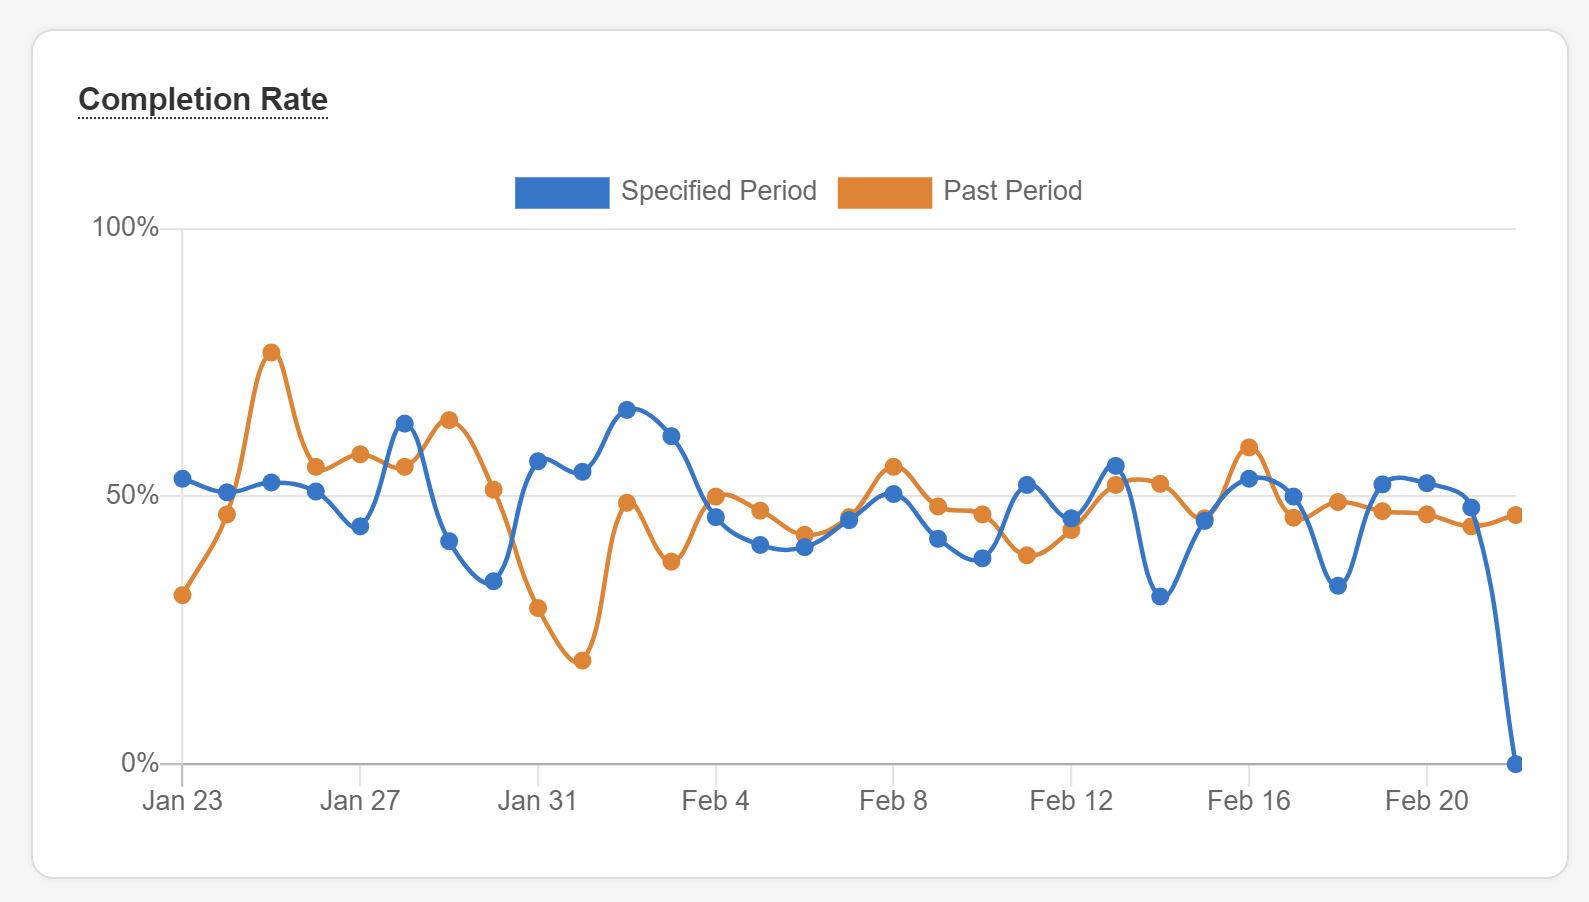
Completion Rate / Comp. Rate - Percentage of people who have engaged with the quiz and completed it.
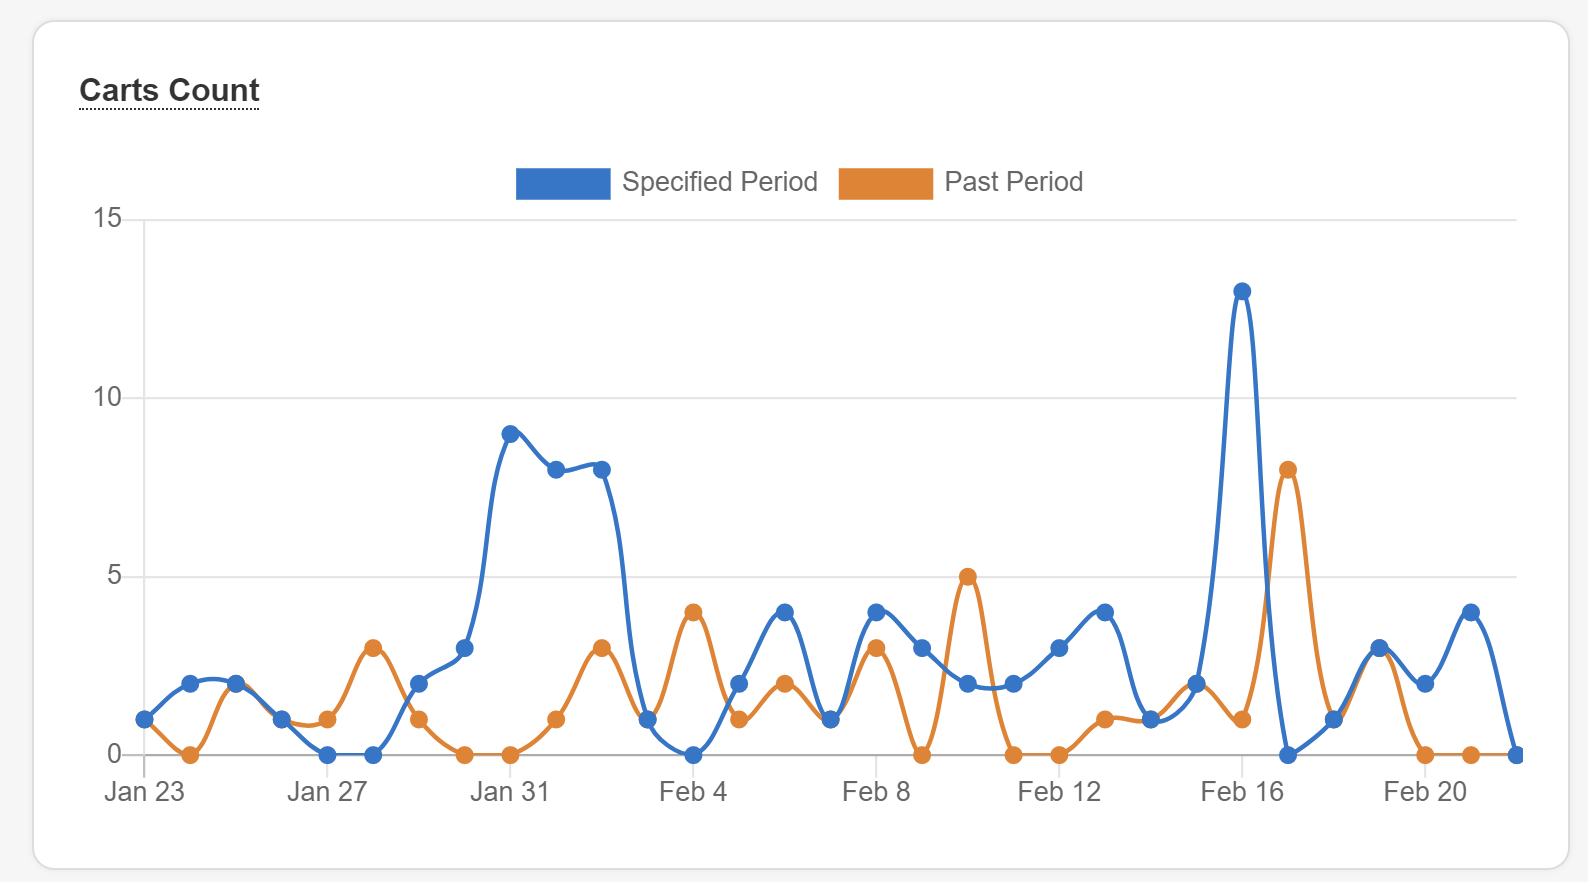
Carts Count / Num. Carts - Number of people who have selected products and clicked on the “proceed to cart” or “proceed to checkout” button.
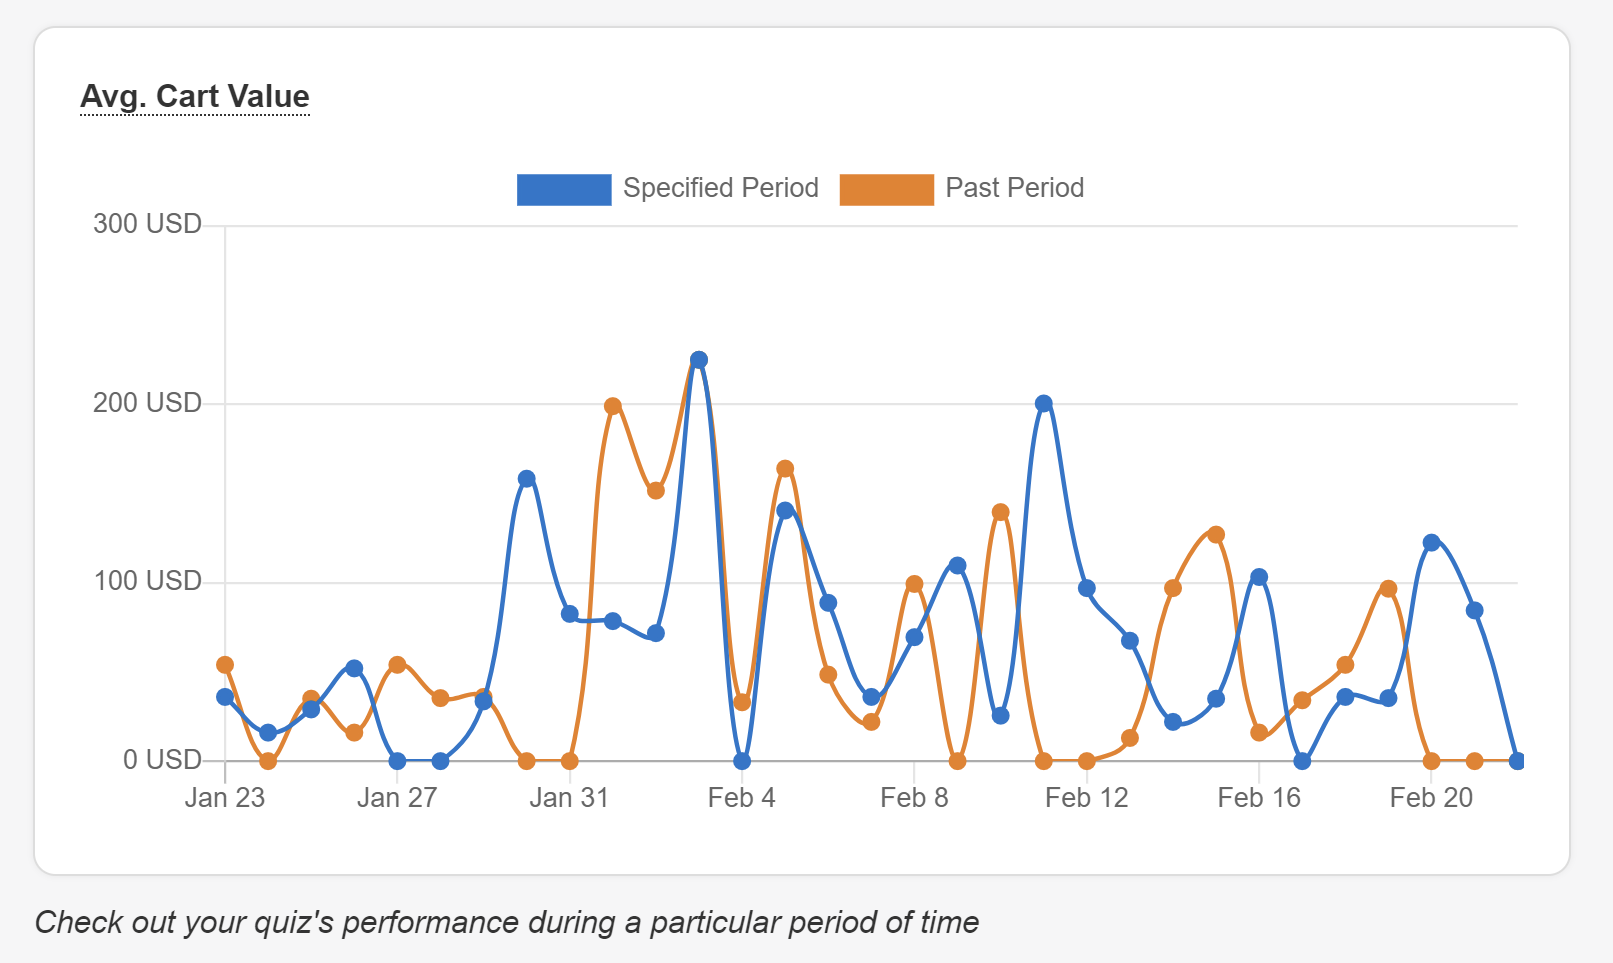
Avg. Cart Value - Average value of the products included in the carts or checkouts.
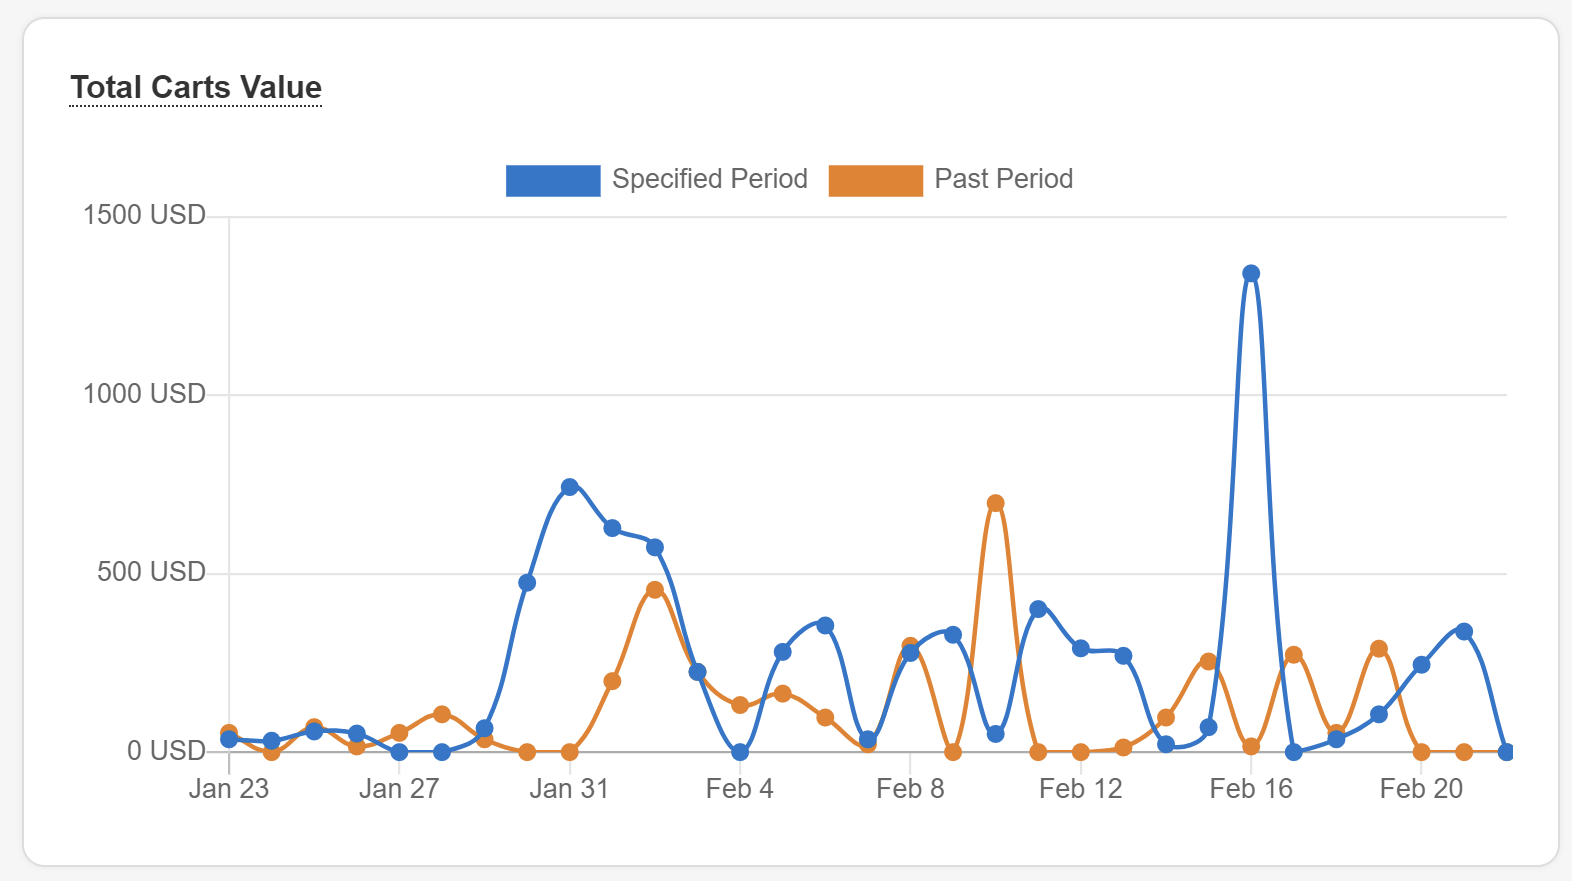
Total Carts Value - Total value of the products included in all the carts or checkouts. This does not represent the total value of purchases since you should expect some drop-off at checkout.
Number of Orders - Number of people who have placed an order after completing this quiz. To track Order values with the RevenueHunt app for Shopify, connect your quiz to the Shopify Revenue Reports via the Connect tab.
Total Orders Value - Total value of orders placed after taking this quiz. To track Order values with the RevenueHunt app for Shopify, connect your quiz to the Shopify Revenue Reports via the Connect tab.
Avg. Order Value - Average value of orders placed after taking this quiz. To track Order values with the RevenueHunt app for Shopify, connect your quiz to the Shopify Revenue Reports via the Connect tab.
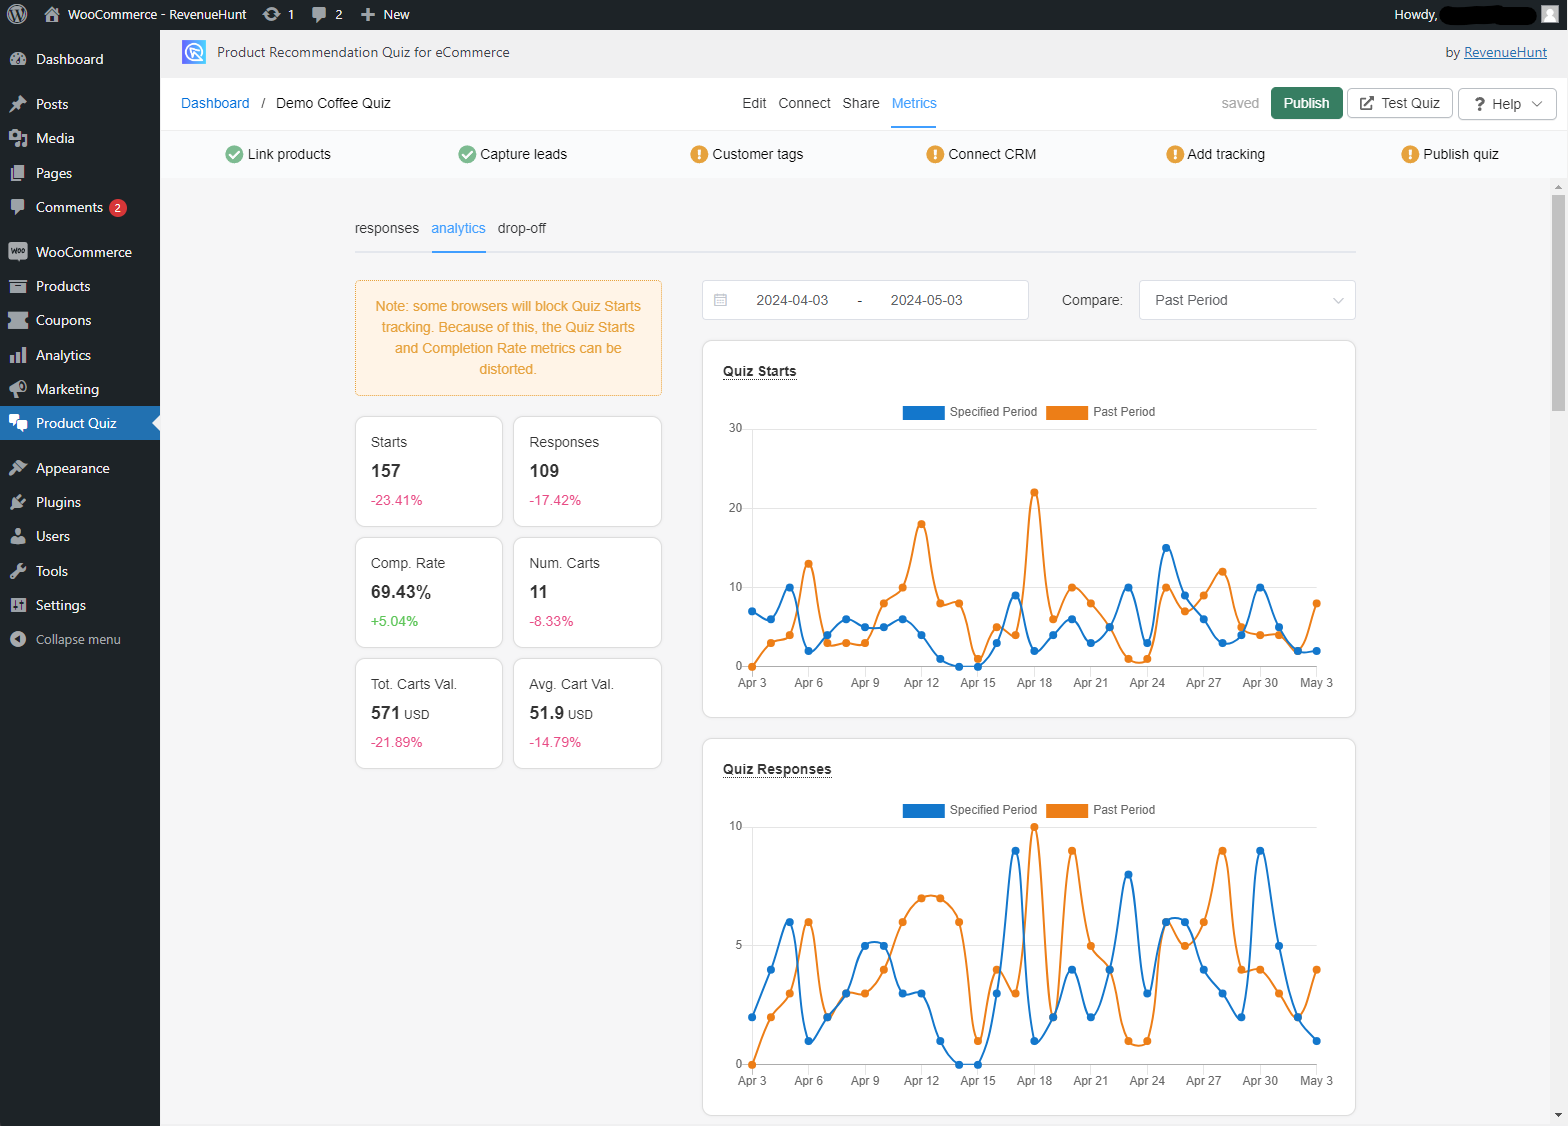
The data in the graphs are totals in a selected period of time for a selected quiz.
To change the dates click on the 📆 icon. You can change the period to select it from the moment you started using the quiz or from a given date.
Compare: - Choose how you want to compare the data in the graphs.
Part Period - Presents data against the values from previous 30 days.
Quiz - Choose a quiz name against which you want to compare the metrics against.
Quiz Starts / Starts - Number of people who engaged with the quiz and passed the first slide. That is, they clicked start quiz or answered the first question.
Quiz Responses / Responses - Number of people who have completed the quiz. Test responses (completed via the Test quiz button) are deleted from your metrics after one hour.
Completion Rate / Comp. Rate - Percentage of people who have engaged with the quiz and completed it.
Carts Count / Num. Carts - Number of people who have selected products and clicked on the “proceed to cart” or “proceed to checkout” button.
Avg. Cart Value - Average value of the products included in the carts or checkouts.
Total Carts Value - Total value of the products included in all the carts or checkouts. This does not represent the total value of purchases since you should expect some drop-off at checkout.
Number of Orders - Number of people who have placed an order after completing this quiz. To track Order values with the RevenueHunt app for Shopify, connect your quiz to the Shopify Revenue Reports via the Connect tab.
Total Orders Value - Total value of orders placed after taking this quiz. To track Order values with the RevenueHunt app for Shopify, connect your quiz to the Shopify Revenue Reports via the Connect tab.
Avg. Order Value - Average value of orders placed after taking this quiz. To track Order values with the RevenueHunt app for Shopify, connect your quiz to the Shopify Revenue Reports via the Connect tab.
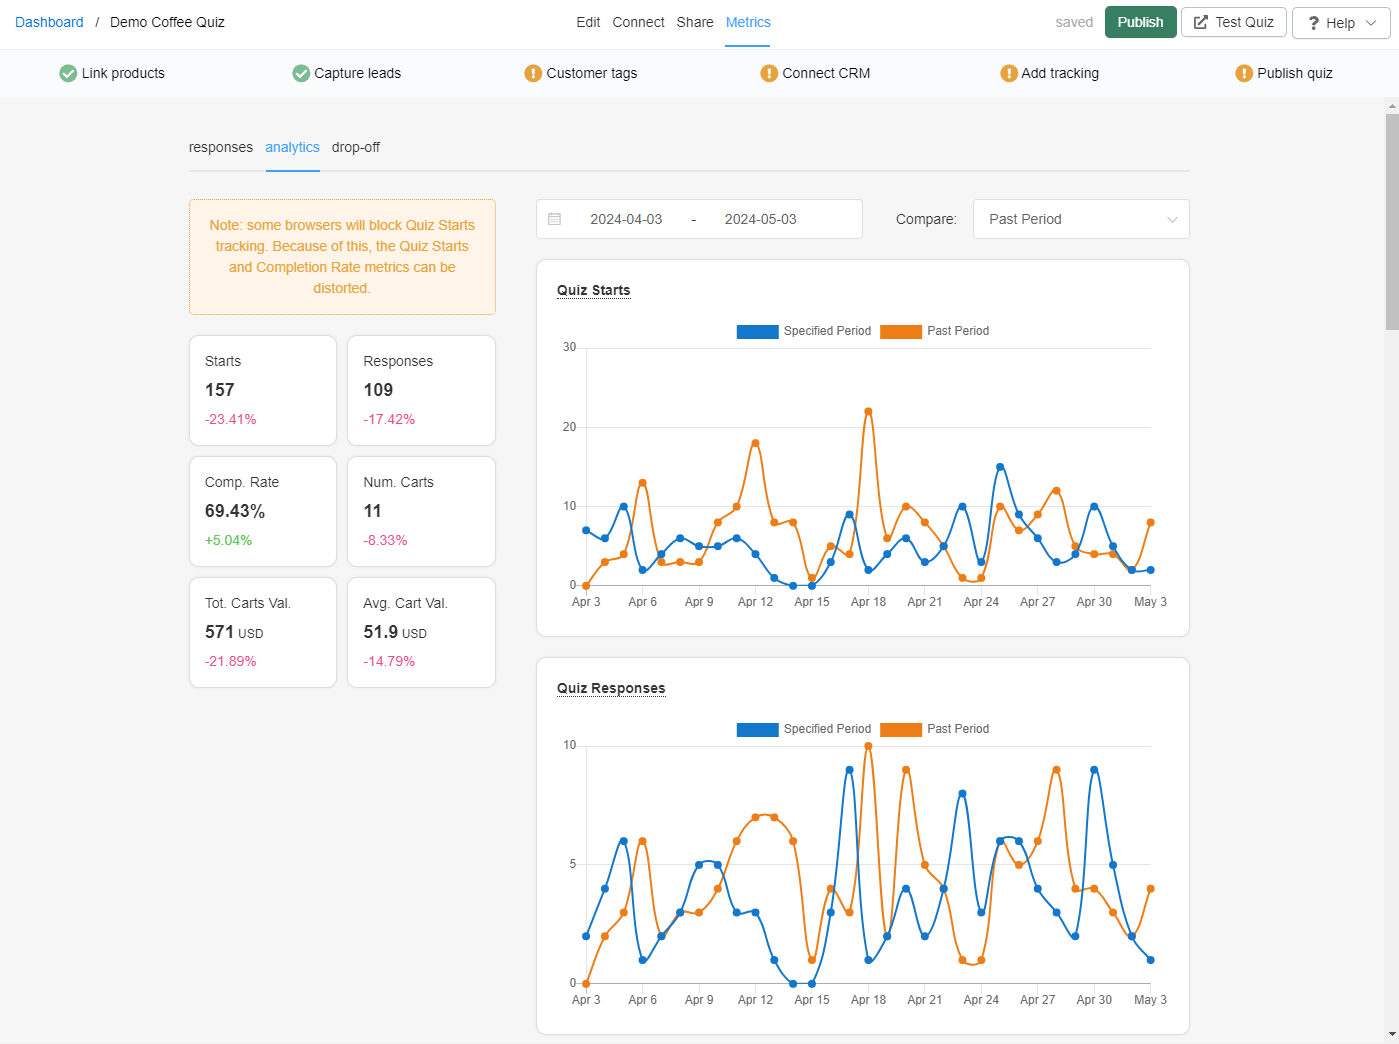
The data in the graphs are totals in a selected period of time for a selected quiz.
To change the dates click on the 📆 icon. You can change the period to select it from the moment you started using the quiz or from a given date.
Compare: - Choose how you want to compare the data in the graphs.
Part Period - Presents data against the values from previous 30 days.
Quiz - Choose a quiz name against which you want to compare the metrics against.
Quiz Starts / Starts - Number of people who engaged with the quiz and passed the first slide. That is, they clicked start quiz or answered the first question.
Quiz Responses / Responses - Number of people who have completed the quiz. Test responses (completed via the Test quiz button) are deleted from your metrics after one hour.
Completion Rate / Comp. Rate - Percentage of people who have engaged with the quiz and completed it.
Carts Count / Num. Carts - Number of people who have selected products and clicked on the “proceed to cart” or “proceed to checkout” button.
Avg. Cart Value - Average value of the products included in the carts or checkouts.
Total Carts Value - Total value of the products included in all the carts or checkouts. This does not represent the total value of purchases since you should expect some drop-off at checkout.
Number of Orders - Number of people who have placed an order after completing this quiz. To track Order values with the RevenueHunt app for Shopify, connect your quiz to the Shopify Revenue Reports via the Connect tab.
Total Orders Value - Total value of orders placed after taking this quiz. To track Order values with the RevenueHunt app for Shopify, connect your quiz to the Shopify Revenue Reports via the Connect tab.
Avg. Order Value - Average value of orders placed after taking this quiz. To track Order values with the RevenueHunt app for Shopify, connect your quiz to the Shopify Revenue Reports via the Connect tab.
The data in the graphs are totals in a selected period of time for a selected quiz.
To change the dates click on the 📆 icon. You can change the period to select it from the moment you started using the quiz or from a given date.
Compare: - Choose how you want to compare the data in the graphs.
Part Period - Presents data against the values from previous 30 days.
Quiz - Choose a quiz name against which you want to compare the metrics against.
Quiz Starts / Starts - Number of people who engaged with the quiz and passed the first slide. That is, they clicked start quiz or answered the first question.
Quiz Responses / Responses - Number of people who have completed the quiz. Test responses (completed via the Test quiz button) are deleted from your metrics after one hour.
Completion Rate / Comp. Rate - Percentage of people who have engaged with the quiz and completed it.
Carts Count / Num. Carts - Number of people who have selected products and clicked on the “proceed to cart” or “proceed to checkout” button.
Avg. Cart Value - Average value of the products included in the carts or checkouts.
Total Carts Value - Total value of the products included in all the carts or checkouts. This does not represent the total value of purchases since you should expect some drop-off at checkout.
Number of Orders - Number of people who have placed an order after completing this quiz. To track Order values with the RevenueHunt app for Shopify, connect your quiz to the Shopify Revenue Reports via the Connect tab.
Total Orders Value - Total value of orders placed after taking this quiz. To track Order values with the RevenueHunt app for Shopify, connect your quiz to the Shopify Revenue Reports via the Connect tab.
Avg. Order Value - Average value of orders placed after taking this quiz. To track Order values with the RevenueHunt app for Shopify, connect your quiz to the Shopify Revenue Reports via the Connect tab.
The data in the graphs are totals in a selected period of time for a selected quiz.
To change the dates click on the 📆 icon. You can change the period to select it from the moment you started using the quiz or from a given date.
Compare: - Choose how you want to compare the data in the graphs.
Part Period - Presents data against the values from previous 30 days.
Quiz - Choose a quiz name against which you want to compare the metrics against.
Quiz Starts / Starts - Number of people who engaged with the quiz and passed the first slide. That is, they clicked start quiz or answered the first question.
Quiz Responses / Responses - Number of people who have completed the quiz. Test responses (completed via the Test quiz button) are deleted from your metrics after one hour.
Completion Rate / Comp. Rate - Percentage of people who have engaged with the quiz and completed it.
Carts Count / Num. Carts - Number of people who have selected products and clicked on the “proceed to cart” or “proceed to checkout” button.
Avg. Cart Value - Average value of the products included in the carts or checkouts.
Total Carts Value - Total value of the products included in all the carts or checkouts. This does not represent the total value of purchases since you should expect some drop-off at checkout.
Number of Orders - Number of people who have placed an order after completing this quiz. To track Order values with the RevenueHunt app for Shopify, connect your quiz to the Shopify Revenue Reports via the Connect tab.
Total Orders Value - Total value of orders placed after taking this quiz. To track Order values with the RevenueHunt app for Shopify, connect your quiz to the Shopify Revenue Reports via the Connect tab.
Avg. Order Value - Average value of orders placed after taking this quiz. To track Order values with the RevenueHunt app for Shopify, connect your quiz to the Shopify Revenue Reports via the Connect tab.
Customize
If you want to edit the Analytics page or add more insights click Customize.
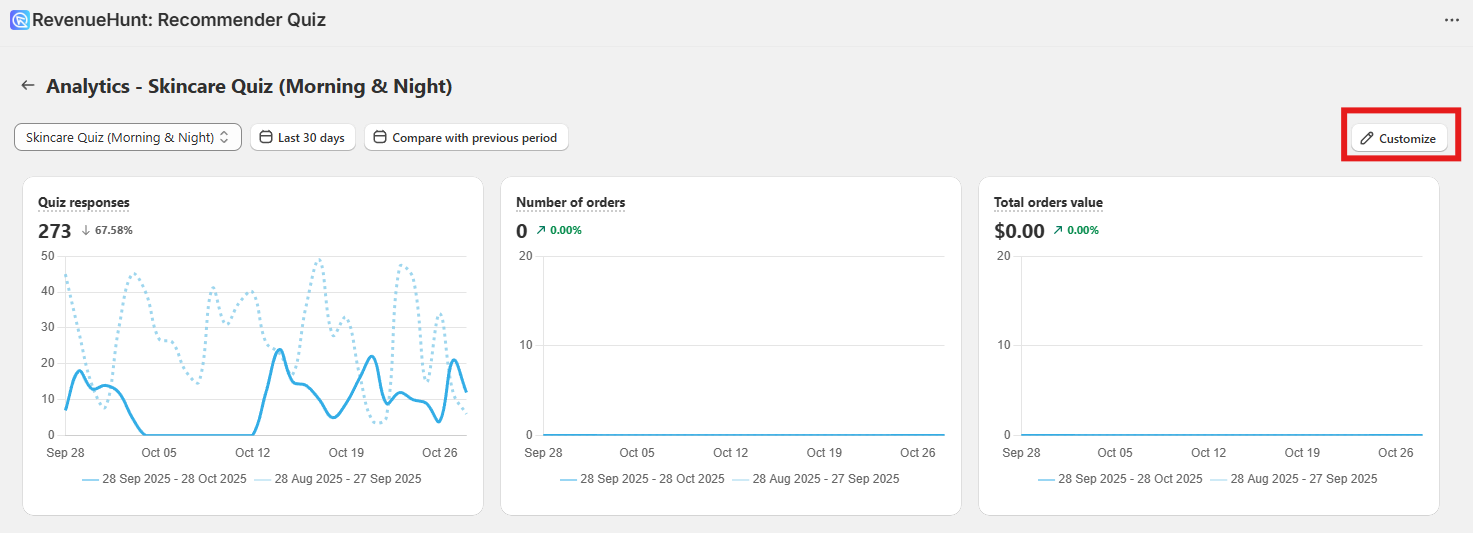
This opens a side bar with the available analytics cards, or blocks:
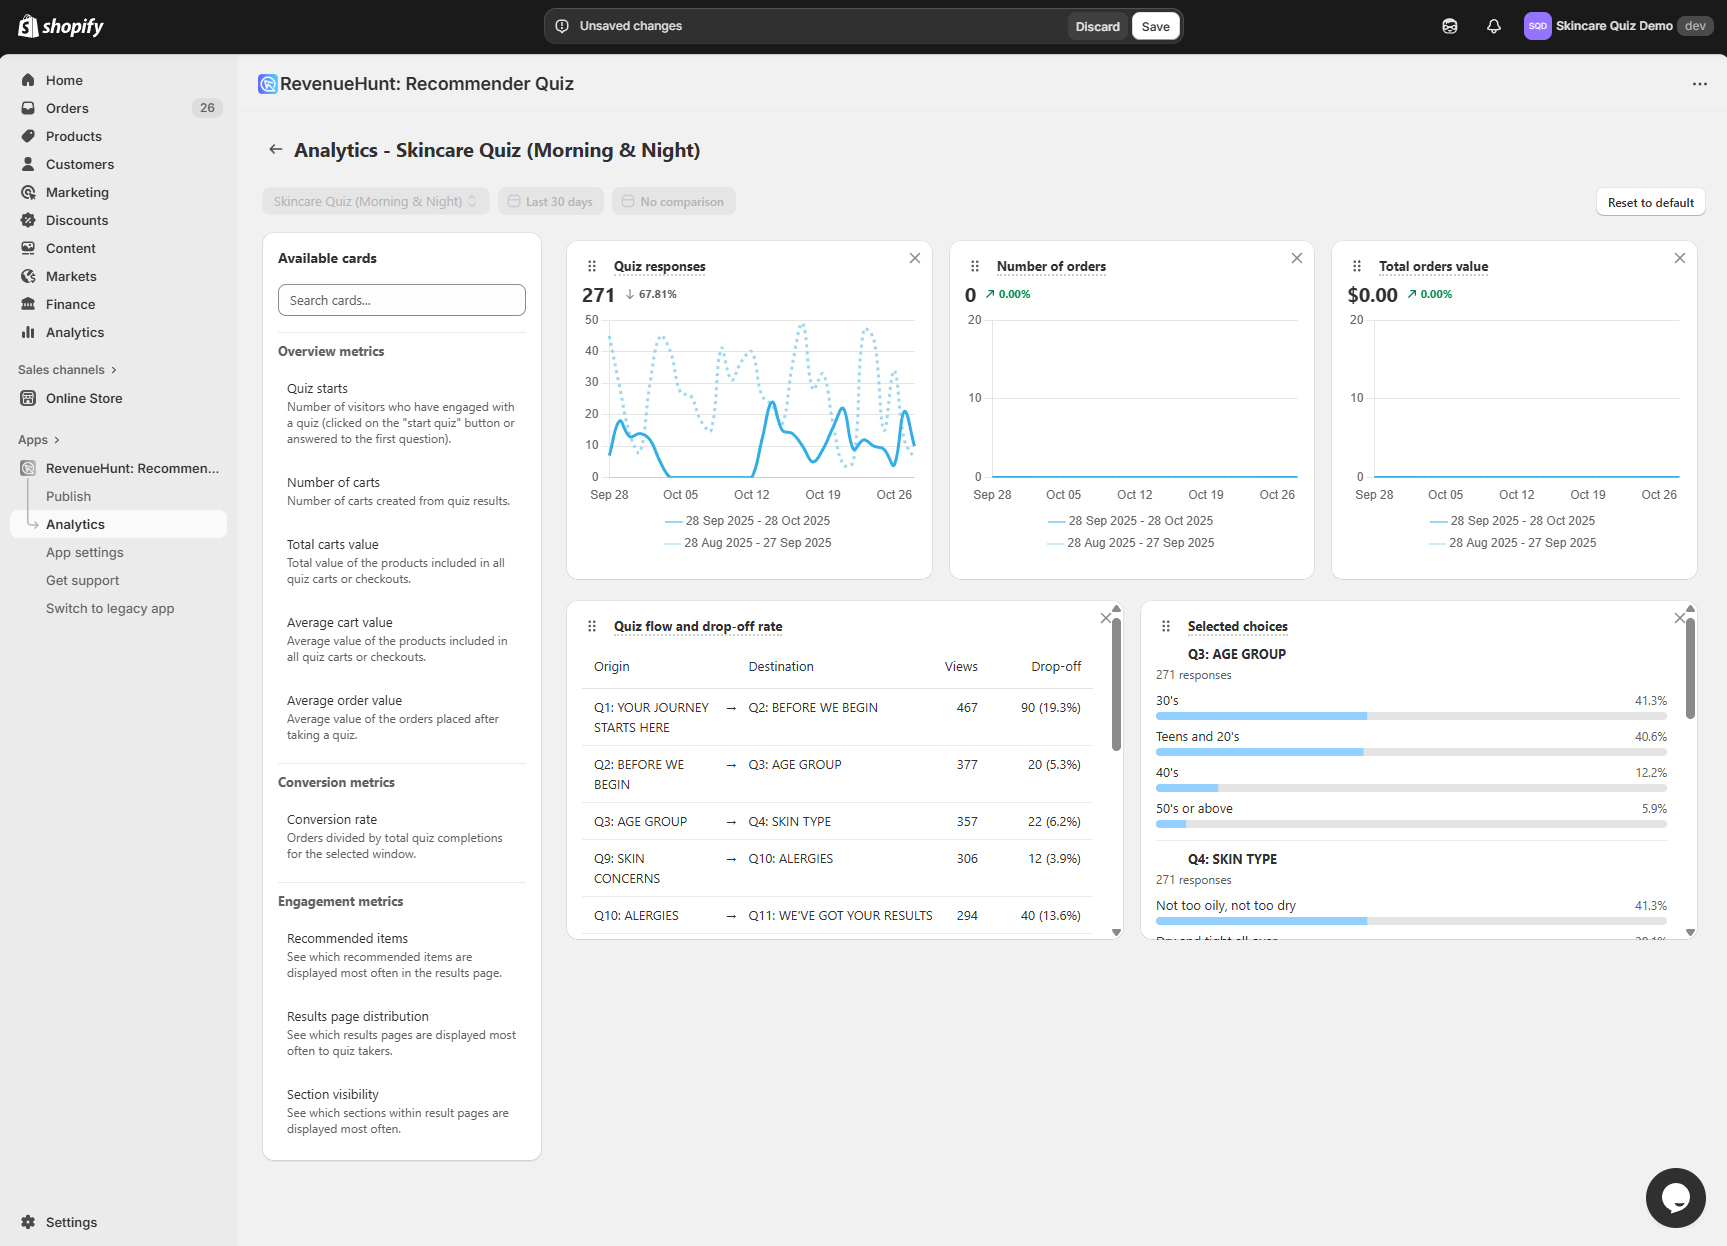
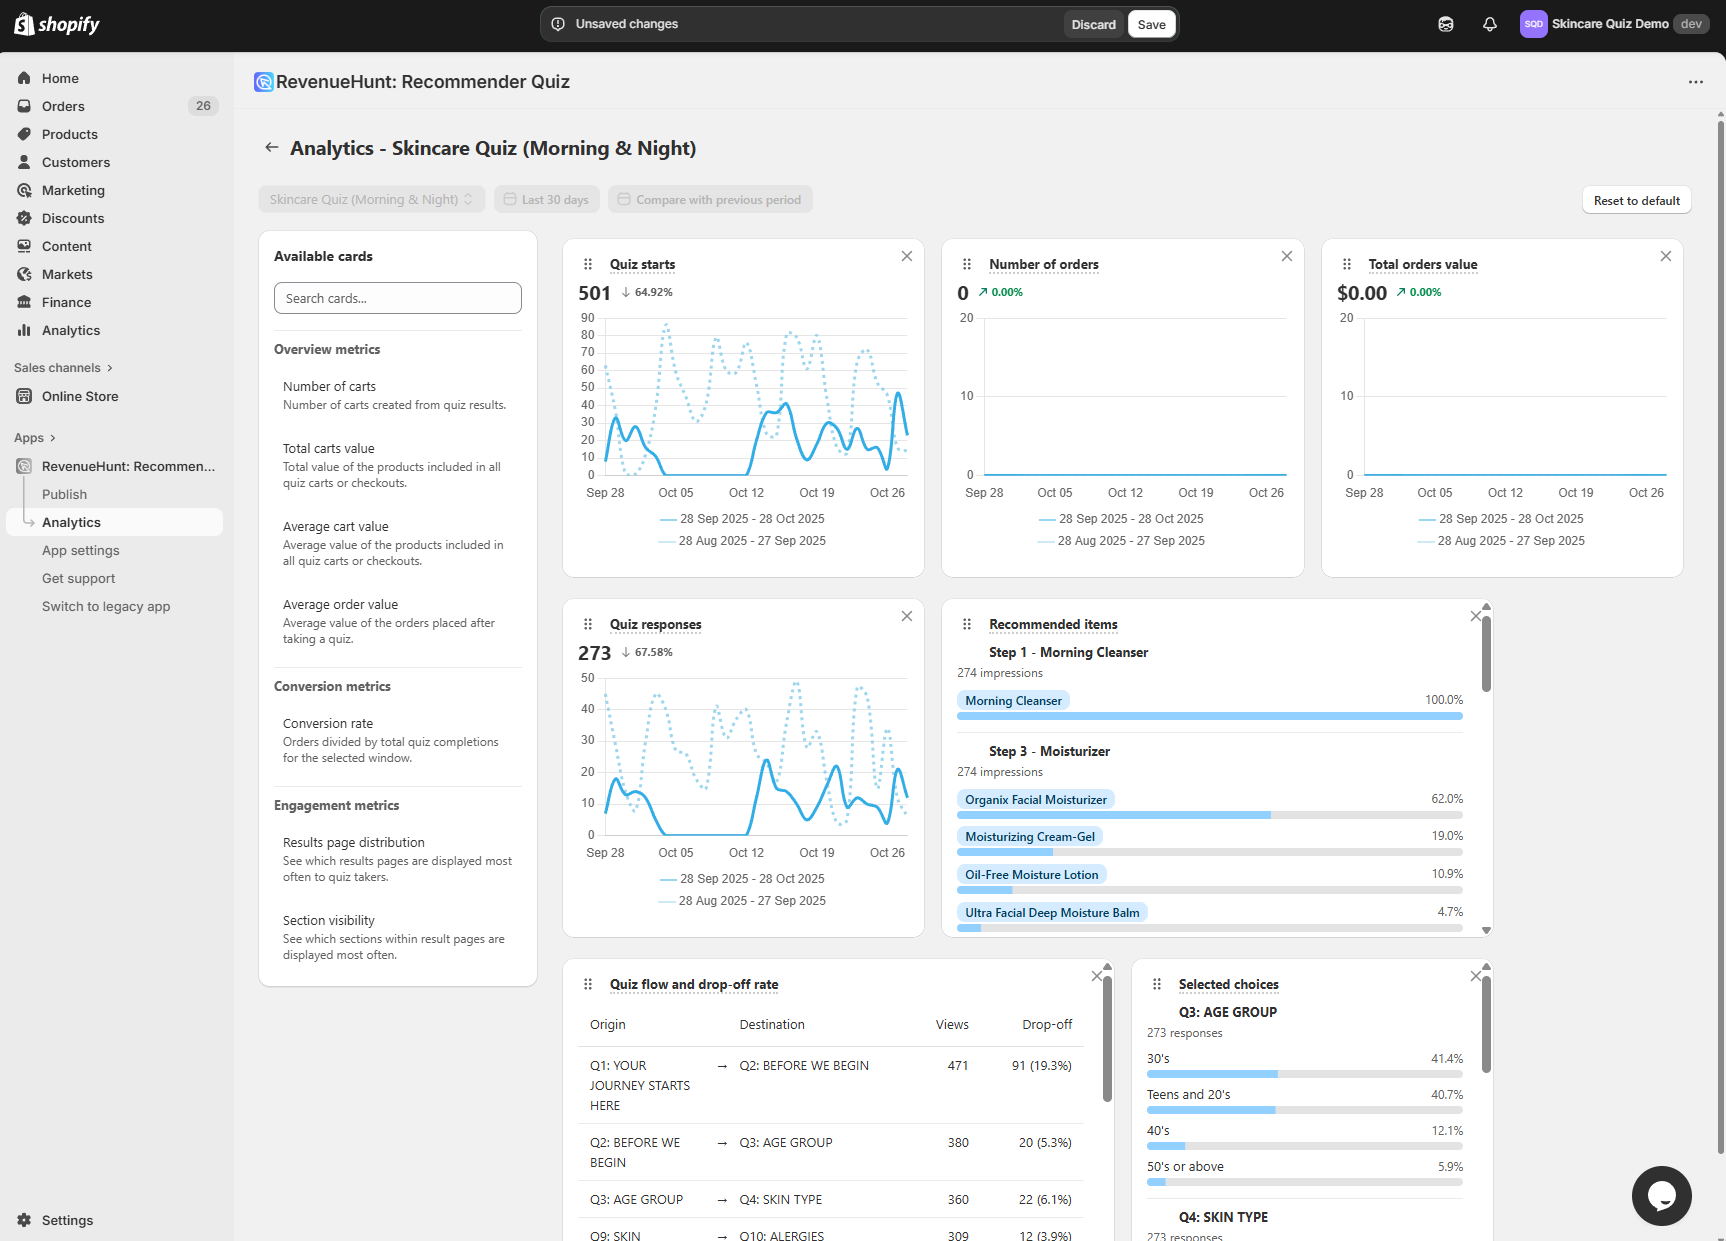
Click on a card you want to add and it is placed on the analytics dashboard. You can then re-arrange and resize each card on the dashboard. Click Save once done editing the analytics dashboard.
Note
Note that the hover-over option for a specific graph is only available once the changes have been saved with the top Save button.
AVAILABLE CARDS
Overview metrics
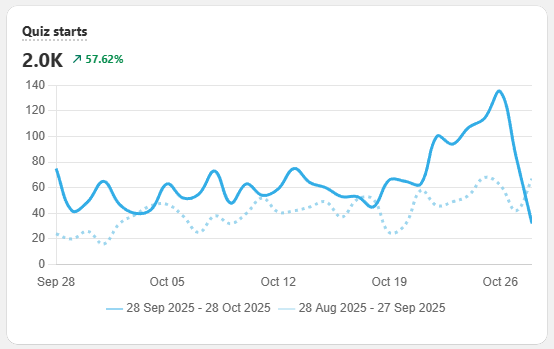
Quiz Starts - Number of people who engaged with the quiz and passed the first slide. That is, they clicked start quiz or answered the first question. 2.0K - number of quiz starts received in a specified period (in black). ↗57.62% - growth compared to last period (in green).
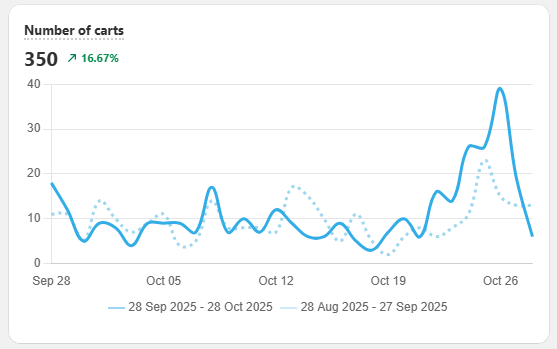
Number of carts - Number of people who have selected products and clicked on the “proceed to cart” or “proceed to checkout” button. 350 - number of carts received in a specified period (in black). ↗16.67% - growth compared to last period (in green).
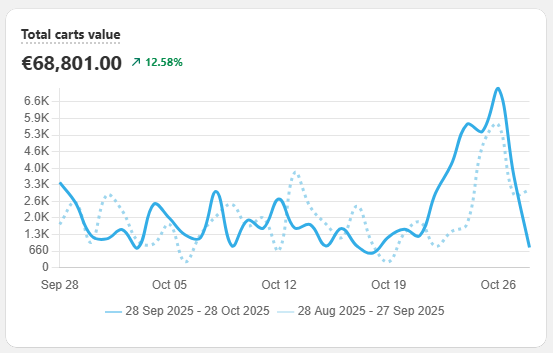
Total carts value - Total value of the products included in all the carts or checkouts. This does not represent the total value of purchases since you should expect some drop-off at checkout. €68,801.00 - total carts value received in a specified period (in black). ↗12.58% - growth compared to last period (in green).
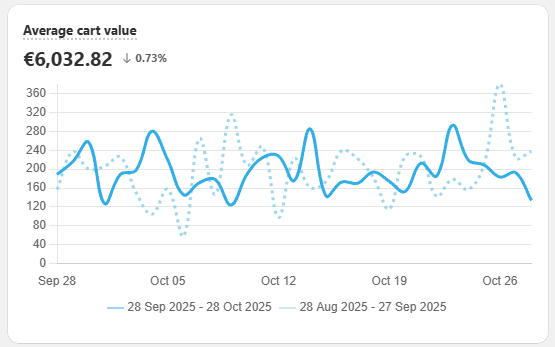
Average cart value - Average value of the products included in all quiz carts or checkouts. €6,032.82 - average carts value received in a specified period (in black). ↙0.73% - growth compared to last period (in green).
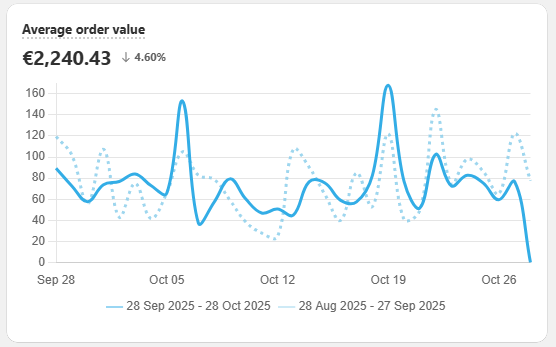
Average order value - Average value of the orders placed after taking a quiz. €2,240.43 - average order value received in a specified period (in black). ↙4.60% - growth compared to last period (in green).
Conversion metrics
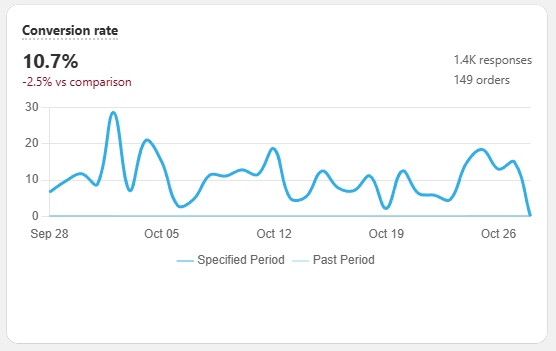
Conversion rate - Orders divided by total quiz completions for the selected window. 10.7%- conversion rate in a specified period (in black). -2.5% - compared to selected comparison quiz/period. 1.4K responses- number of responses in a specified period. 149 orders - number of orders received in a specified period.
Engagement metrics
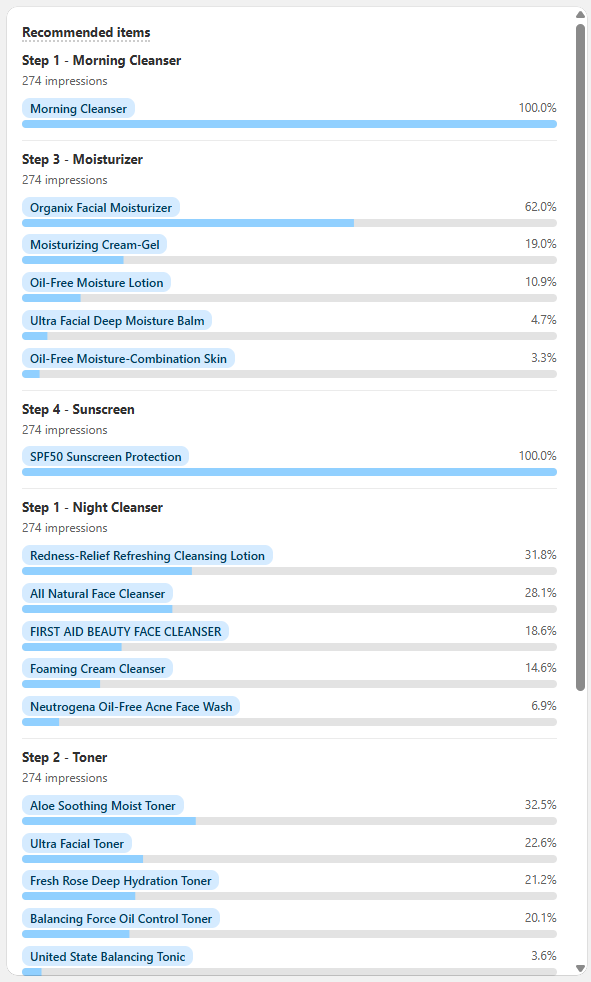
Recommended items- See which recommended items are displayed most often in the results page. Shows which products were displayed most often on the Results page of your quiz. Each bar represents the share of total quiz completions in which a specific product appeared as a recommendation. Step titles (e.g. Step 1 – Cleanser, Step 3 – Moisturizer) correspond to the product slots or sections you configured in your quiz results. Impressions indicate how many times that step or product was shown to customers during the selected time range. Percentages show the relative frequency of each product being displayed within its step.
Example
In Step 3 – Moisturizer, from 274 impressions, 62.0% of customers were shown Organix Facial Moisturizer, 19.0% saw Moisturizing Cream-Gel, 10.9% saw Oil-Free Moisture Lotion, 4.7% saw Ultra Facial Deep Moisture Balm, and 3.3% saw Oil-Free Moisture – Combination Skin.
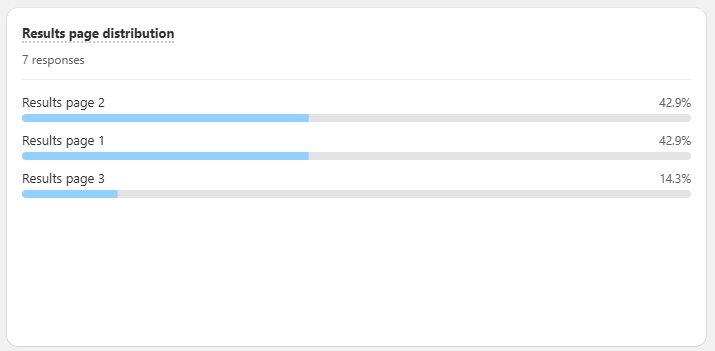
Results page distribution - See which results pages are displayed most often to customers. Shows how often each results page in your quiz is displayed to customers. Each bar represents the share of total quiz completions that led to a particular results page. Responses indicate the total number of completed quizzes in the selected period. Percentages show how frequently each results page appeared relative to total completions.
Example
From 7 responses, 42.9% of customers saw Results page 2, 42.9% saw Results page 1, and 14.3% saw Results page 3.
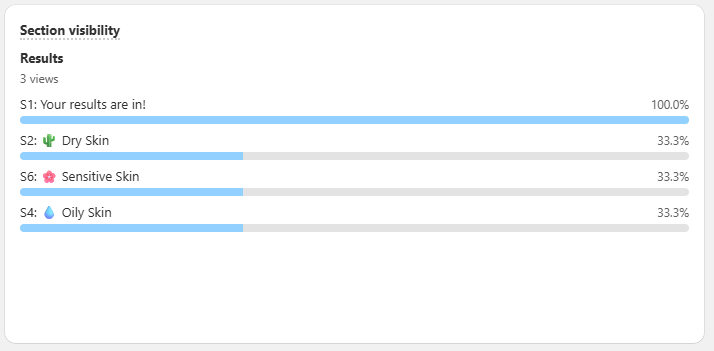
Section visibility- See which sections within results pages are displayed most often. Shows how often each section within your results pages is displayed to quiz customers. Each bar represents the percentage of total result views where that section appeared. Views indicate the number of quiz completions that triggered each section to be shown. Percentages reflect how frequently each section was visible relative to all result views.
Example
From 3 views, 100% of customers saw S1: Your results are in!, while S2: Dry Skin, S4: Oily Skin, and S6: Sensitive Skin each appeared in 33.3% of results.
Customizing the Analytics tab is a Built for Shopify feature
This version of the app has a fixed Analytics tab. You cannot add, remove or rearrange the cards.
Customizing the Analytics tab is a Built for Shopify feature
This version of the app has a fixed Analytics tab. You cannot add, remove or rearrange the cards.
Customizing the Analytics tab is a Built for Shopify feature
This version of the app has a fixed Analytics tab. You cannot add, remove or rearrange the cards.
Customizing the Analytics tab is a Built for Shopify feature
This version of the app has a fixed Analytics tab. You cannot add, remove or rearrange the cards.
Customizing the Analytics tab is a Built for Shopify feature
This version of the app has a fixed Analytics tab. You cannot add, remove or rearrange the cards.
Drop-off
The Drop-off data (drop-off rate per question) is available by default in the Analytics section of the Quiz builder.
Drop-off rate - Counts of key funnel events captured during the selected period, and the drop-off rate for each step. This table shows how customers move through your quiz, from the first question to the results and checkout, and where they drop off.
Origin - The slide or question where customers started a step in the flow.
Destination - The next slide or page they reached.
Views- The number of times this transition occurred during the selected time range.
Share of Step - The percentage (and number) of customers who exited the quiz instead of continuing to the next step.
Outcome - Continued or Exited the quiz.
How drop-off is measured
The drop-off rate is measured from events, which fire whenever someone starts a quiz. Ad blockers in the browser can block some of those start events. The quiz starts figure in the analytics tab is adjusted to include the blocked starts, so it can differ from the drop-off rate.
Reducing drop-off
A high drop-off rate may indicate confusion, friction, or lack of engagement at that step. Try simplifying the question, reducing required inputs, or improving the design and copy to keep customers moving forward.
See how to reduce drop-off and maximize quiz completion rate.
Alternative ways to measure drop-off
You can also measure the drop-off per choice or question by connecting the quiz to Google Analytics or Meta Pixel.
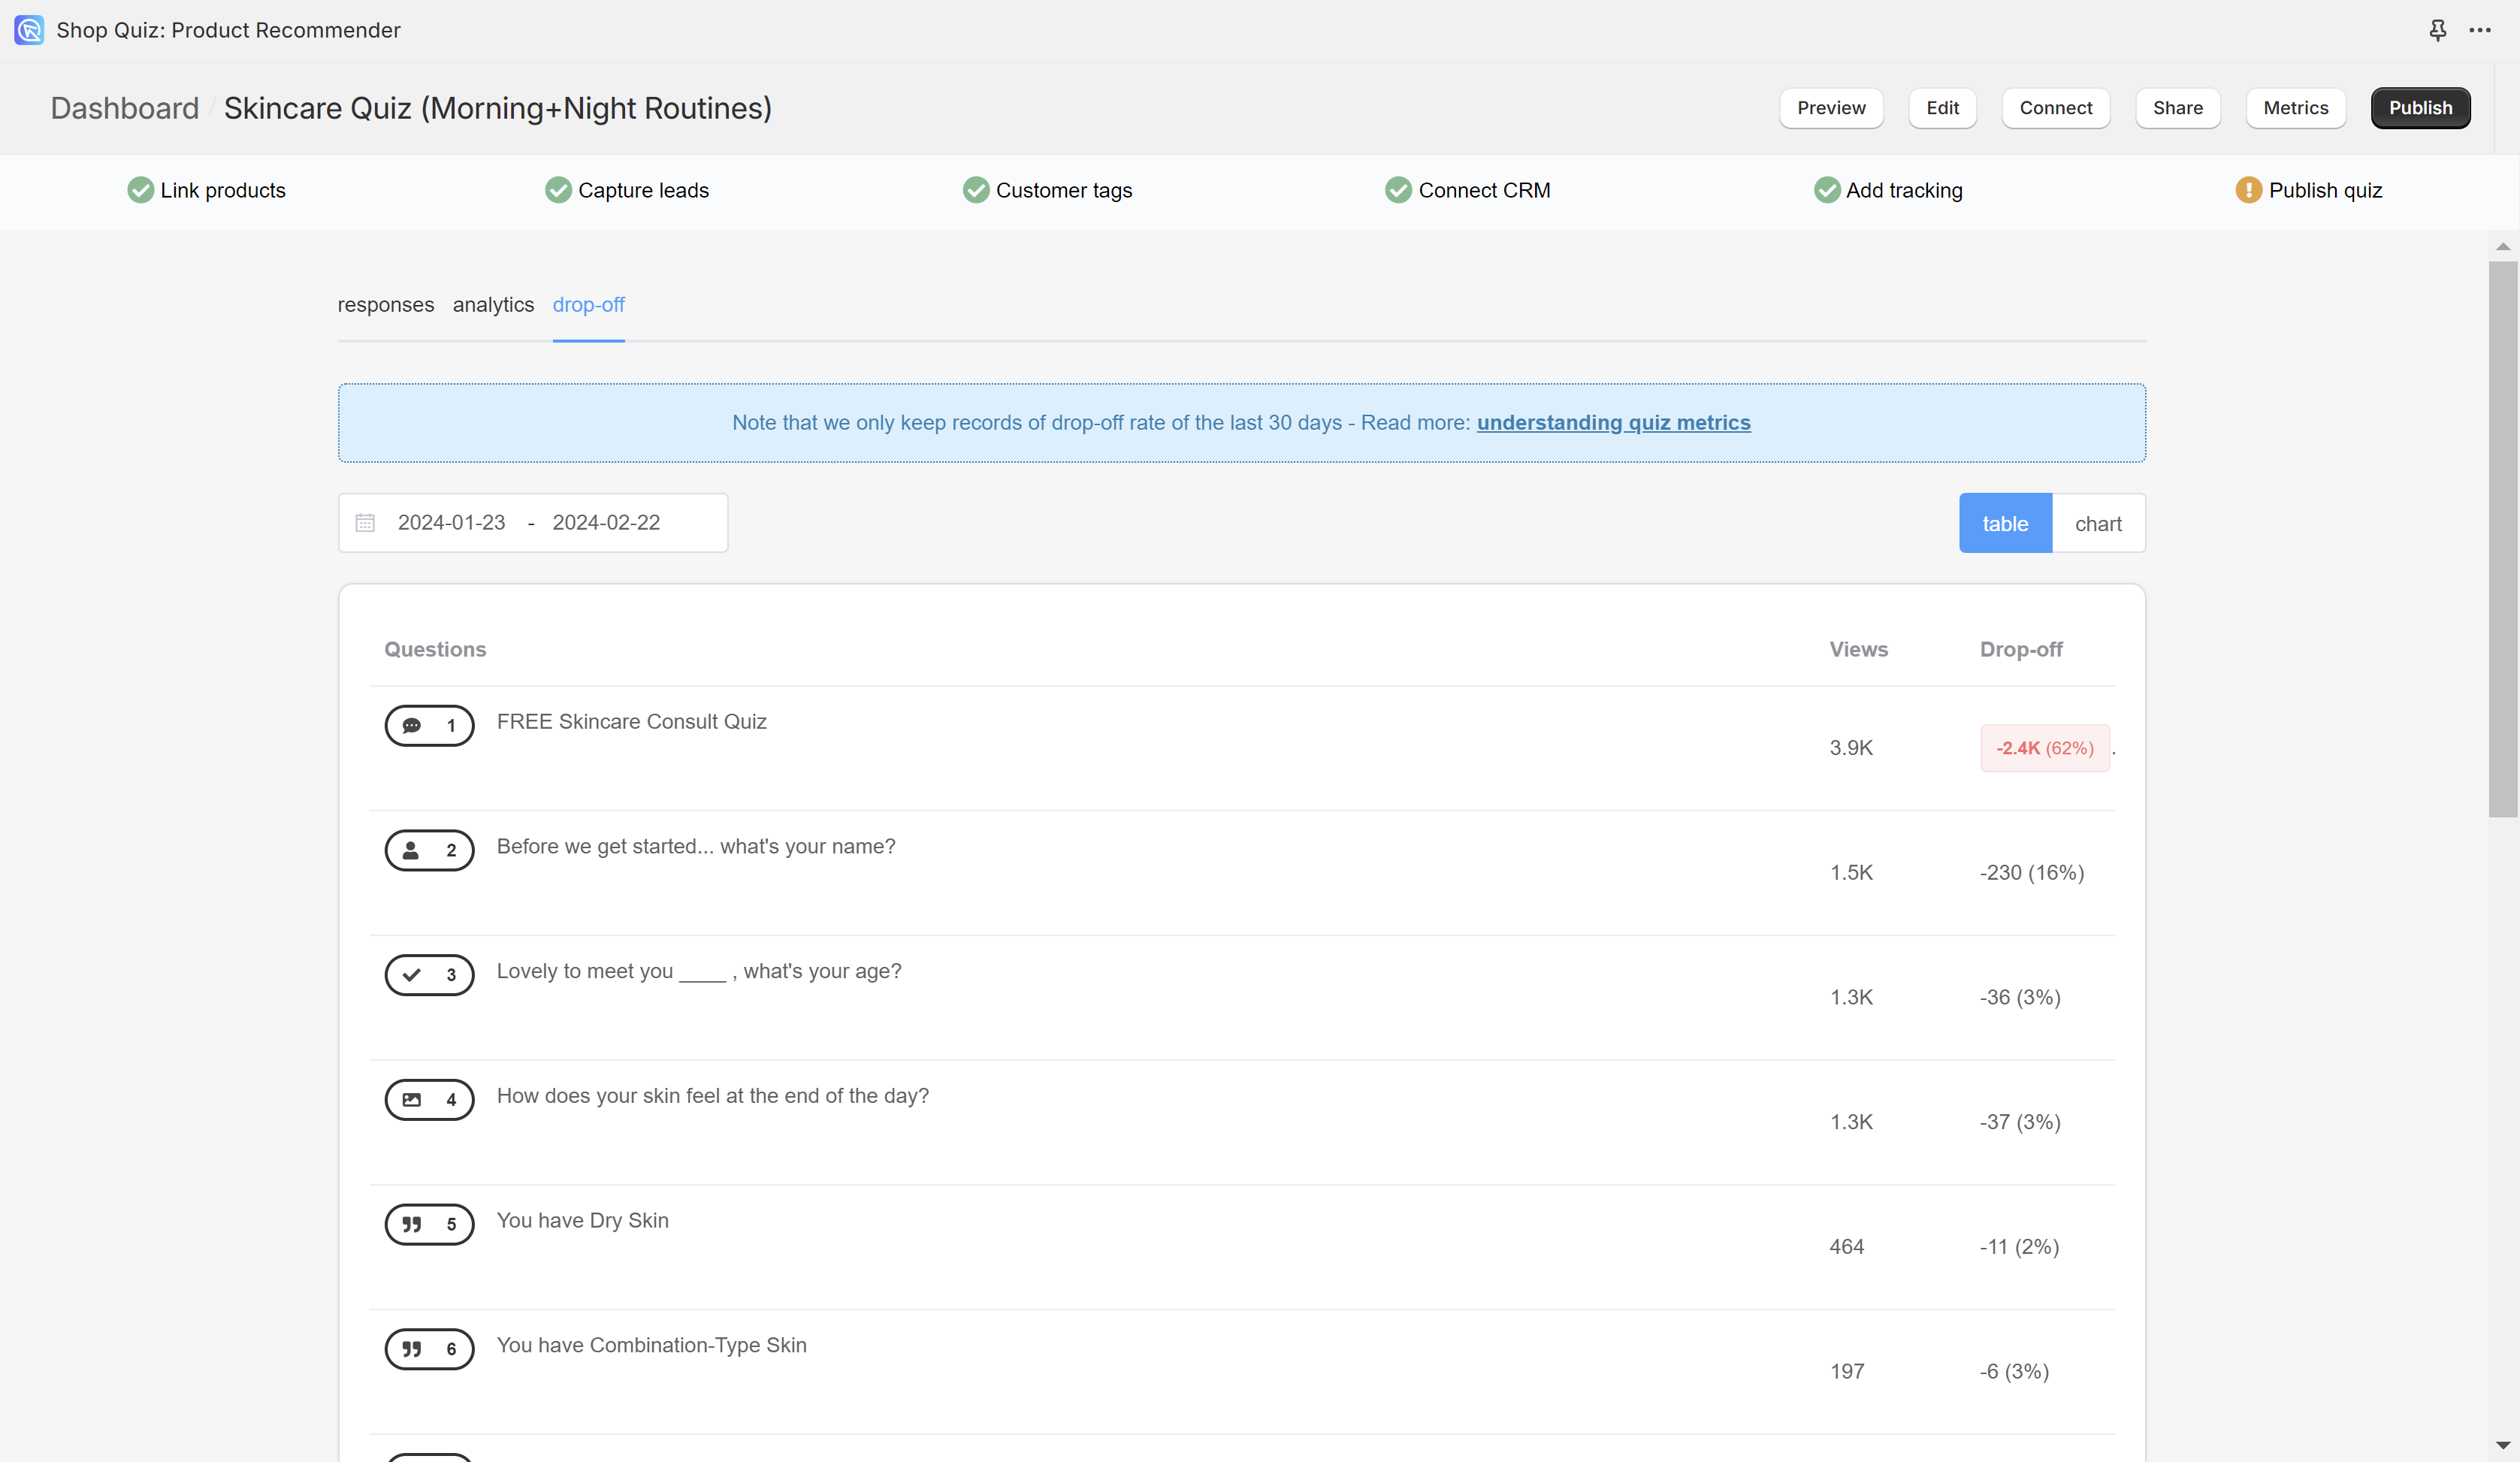
The drop-off rate is measured from events, which fire whenever someone starts a quiz. Ad blockers in the browser can block some of those start events. The quiz starts figure in the analytics tab is adjusted to include the blocked starts, so it can differ from the drop-off rate.

To change the dates click on the 📆 icon. You can change the period to select it from the moment you started using the quiz or from a given date.
table - Displays the drop-off rate for each question and the results page in a table format.
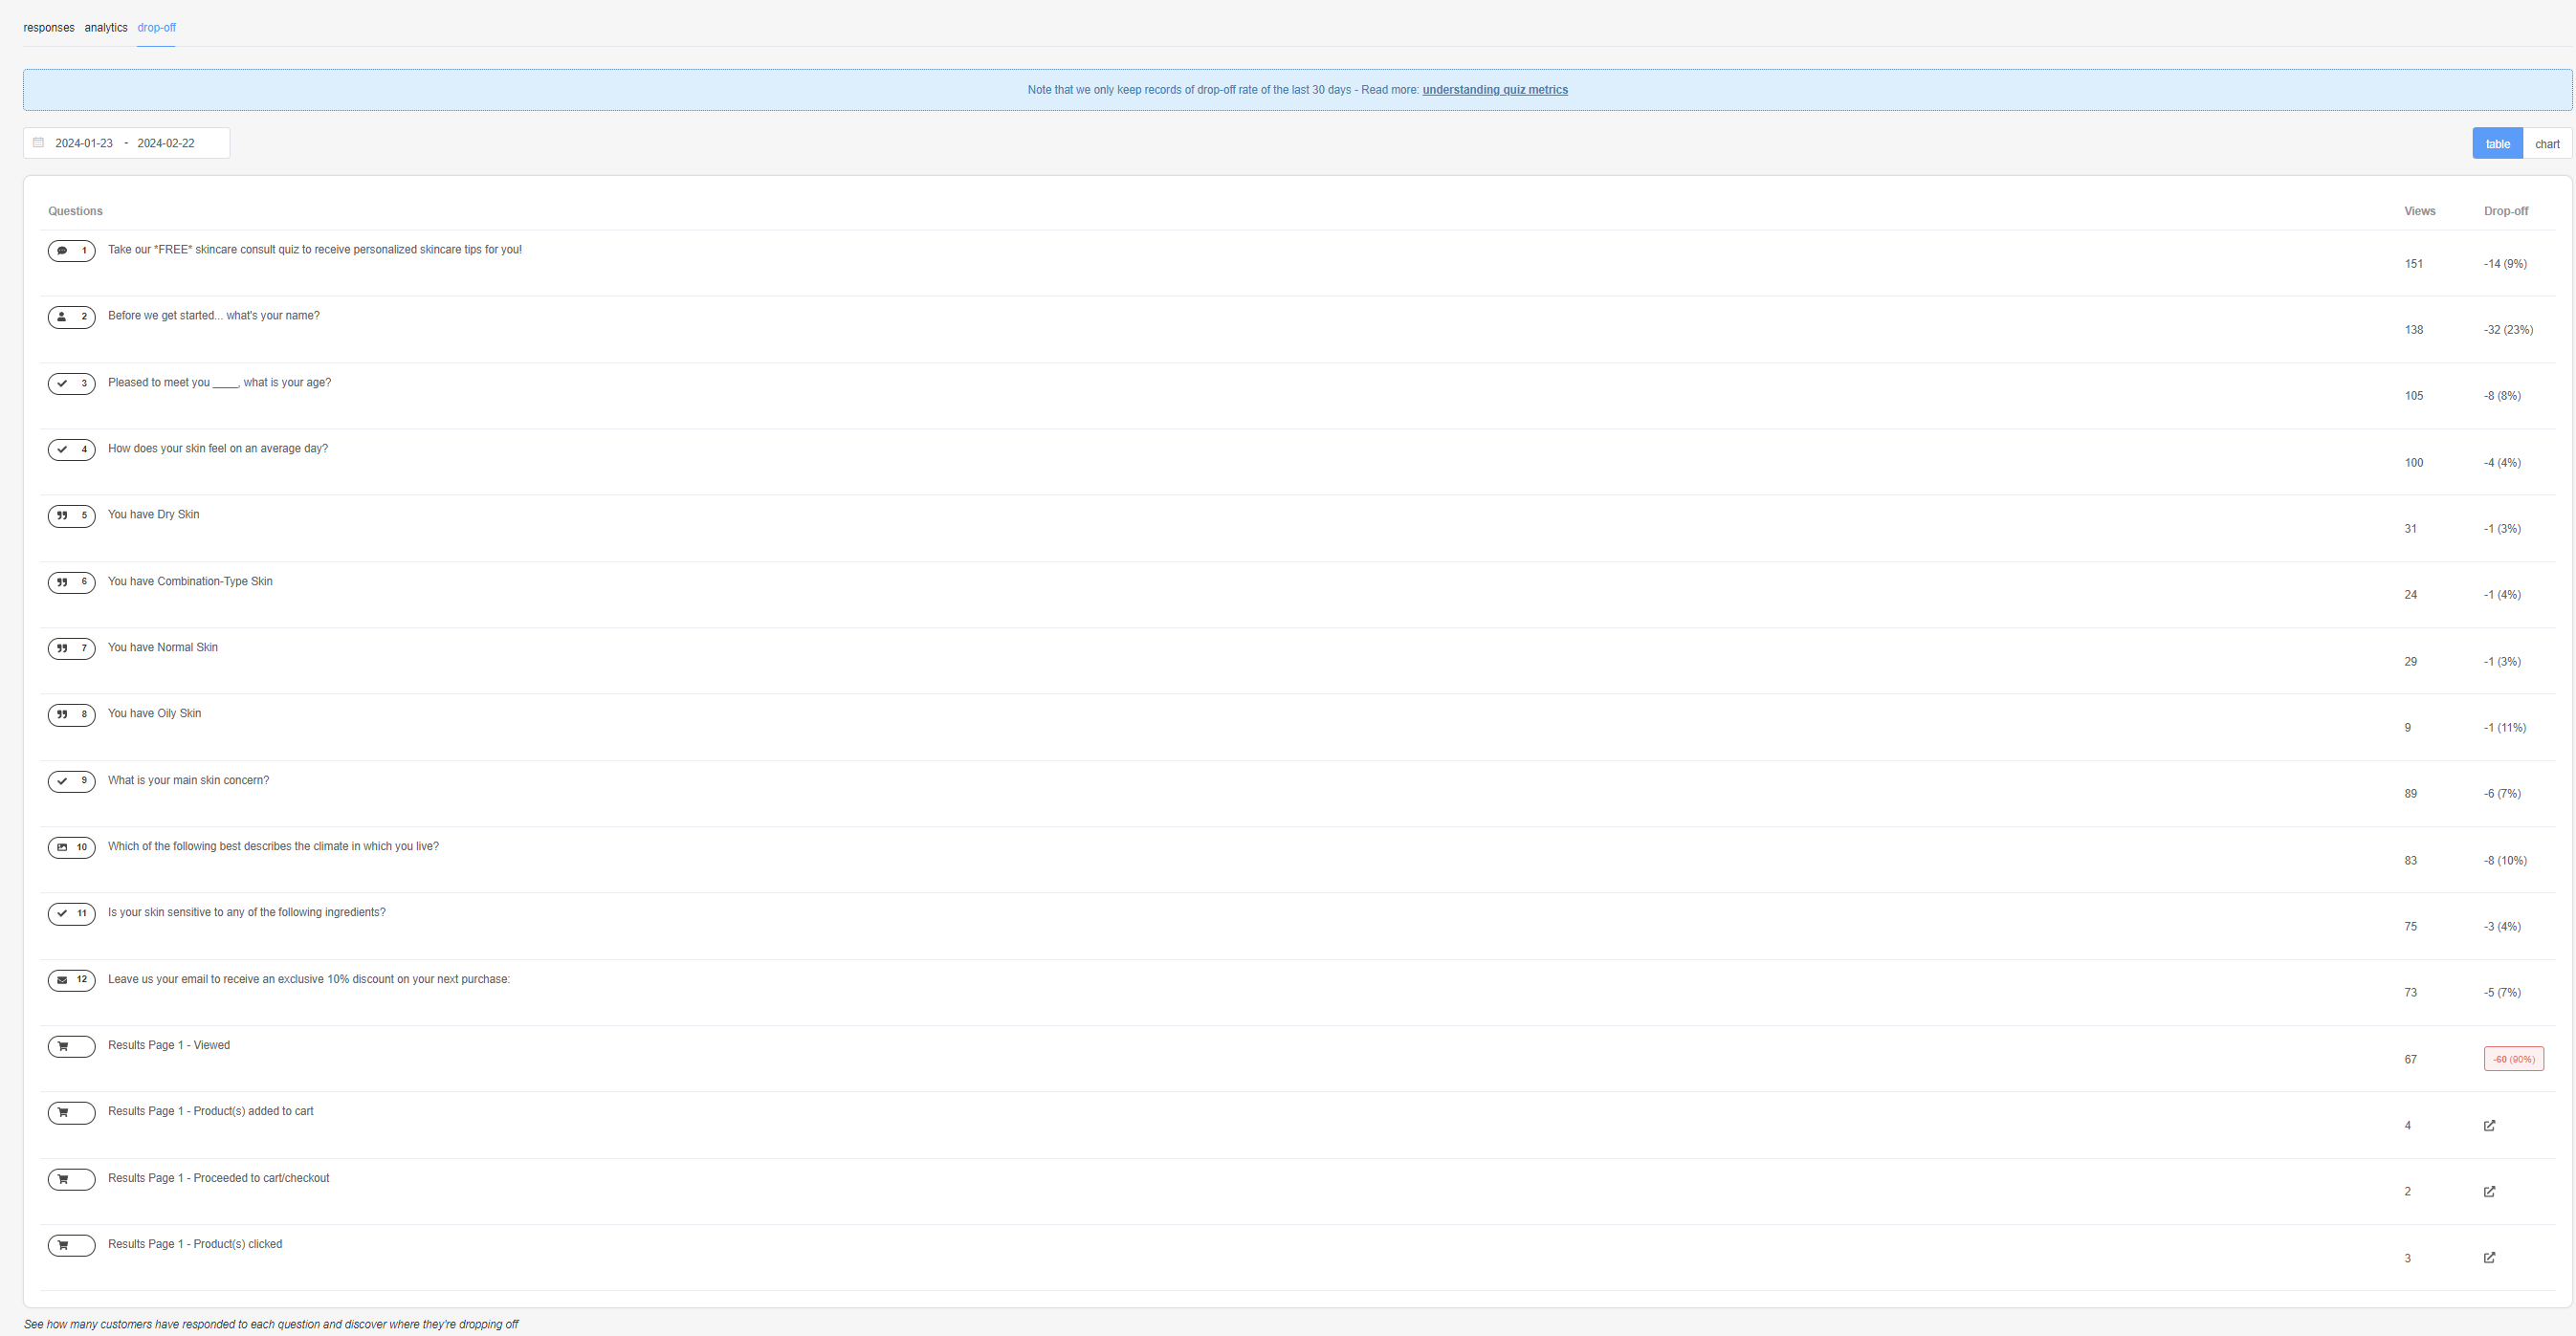
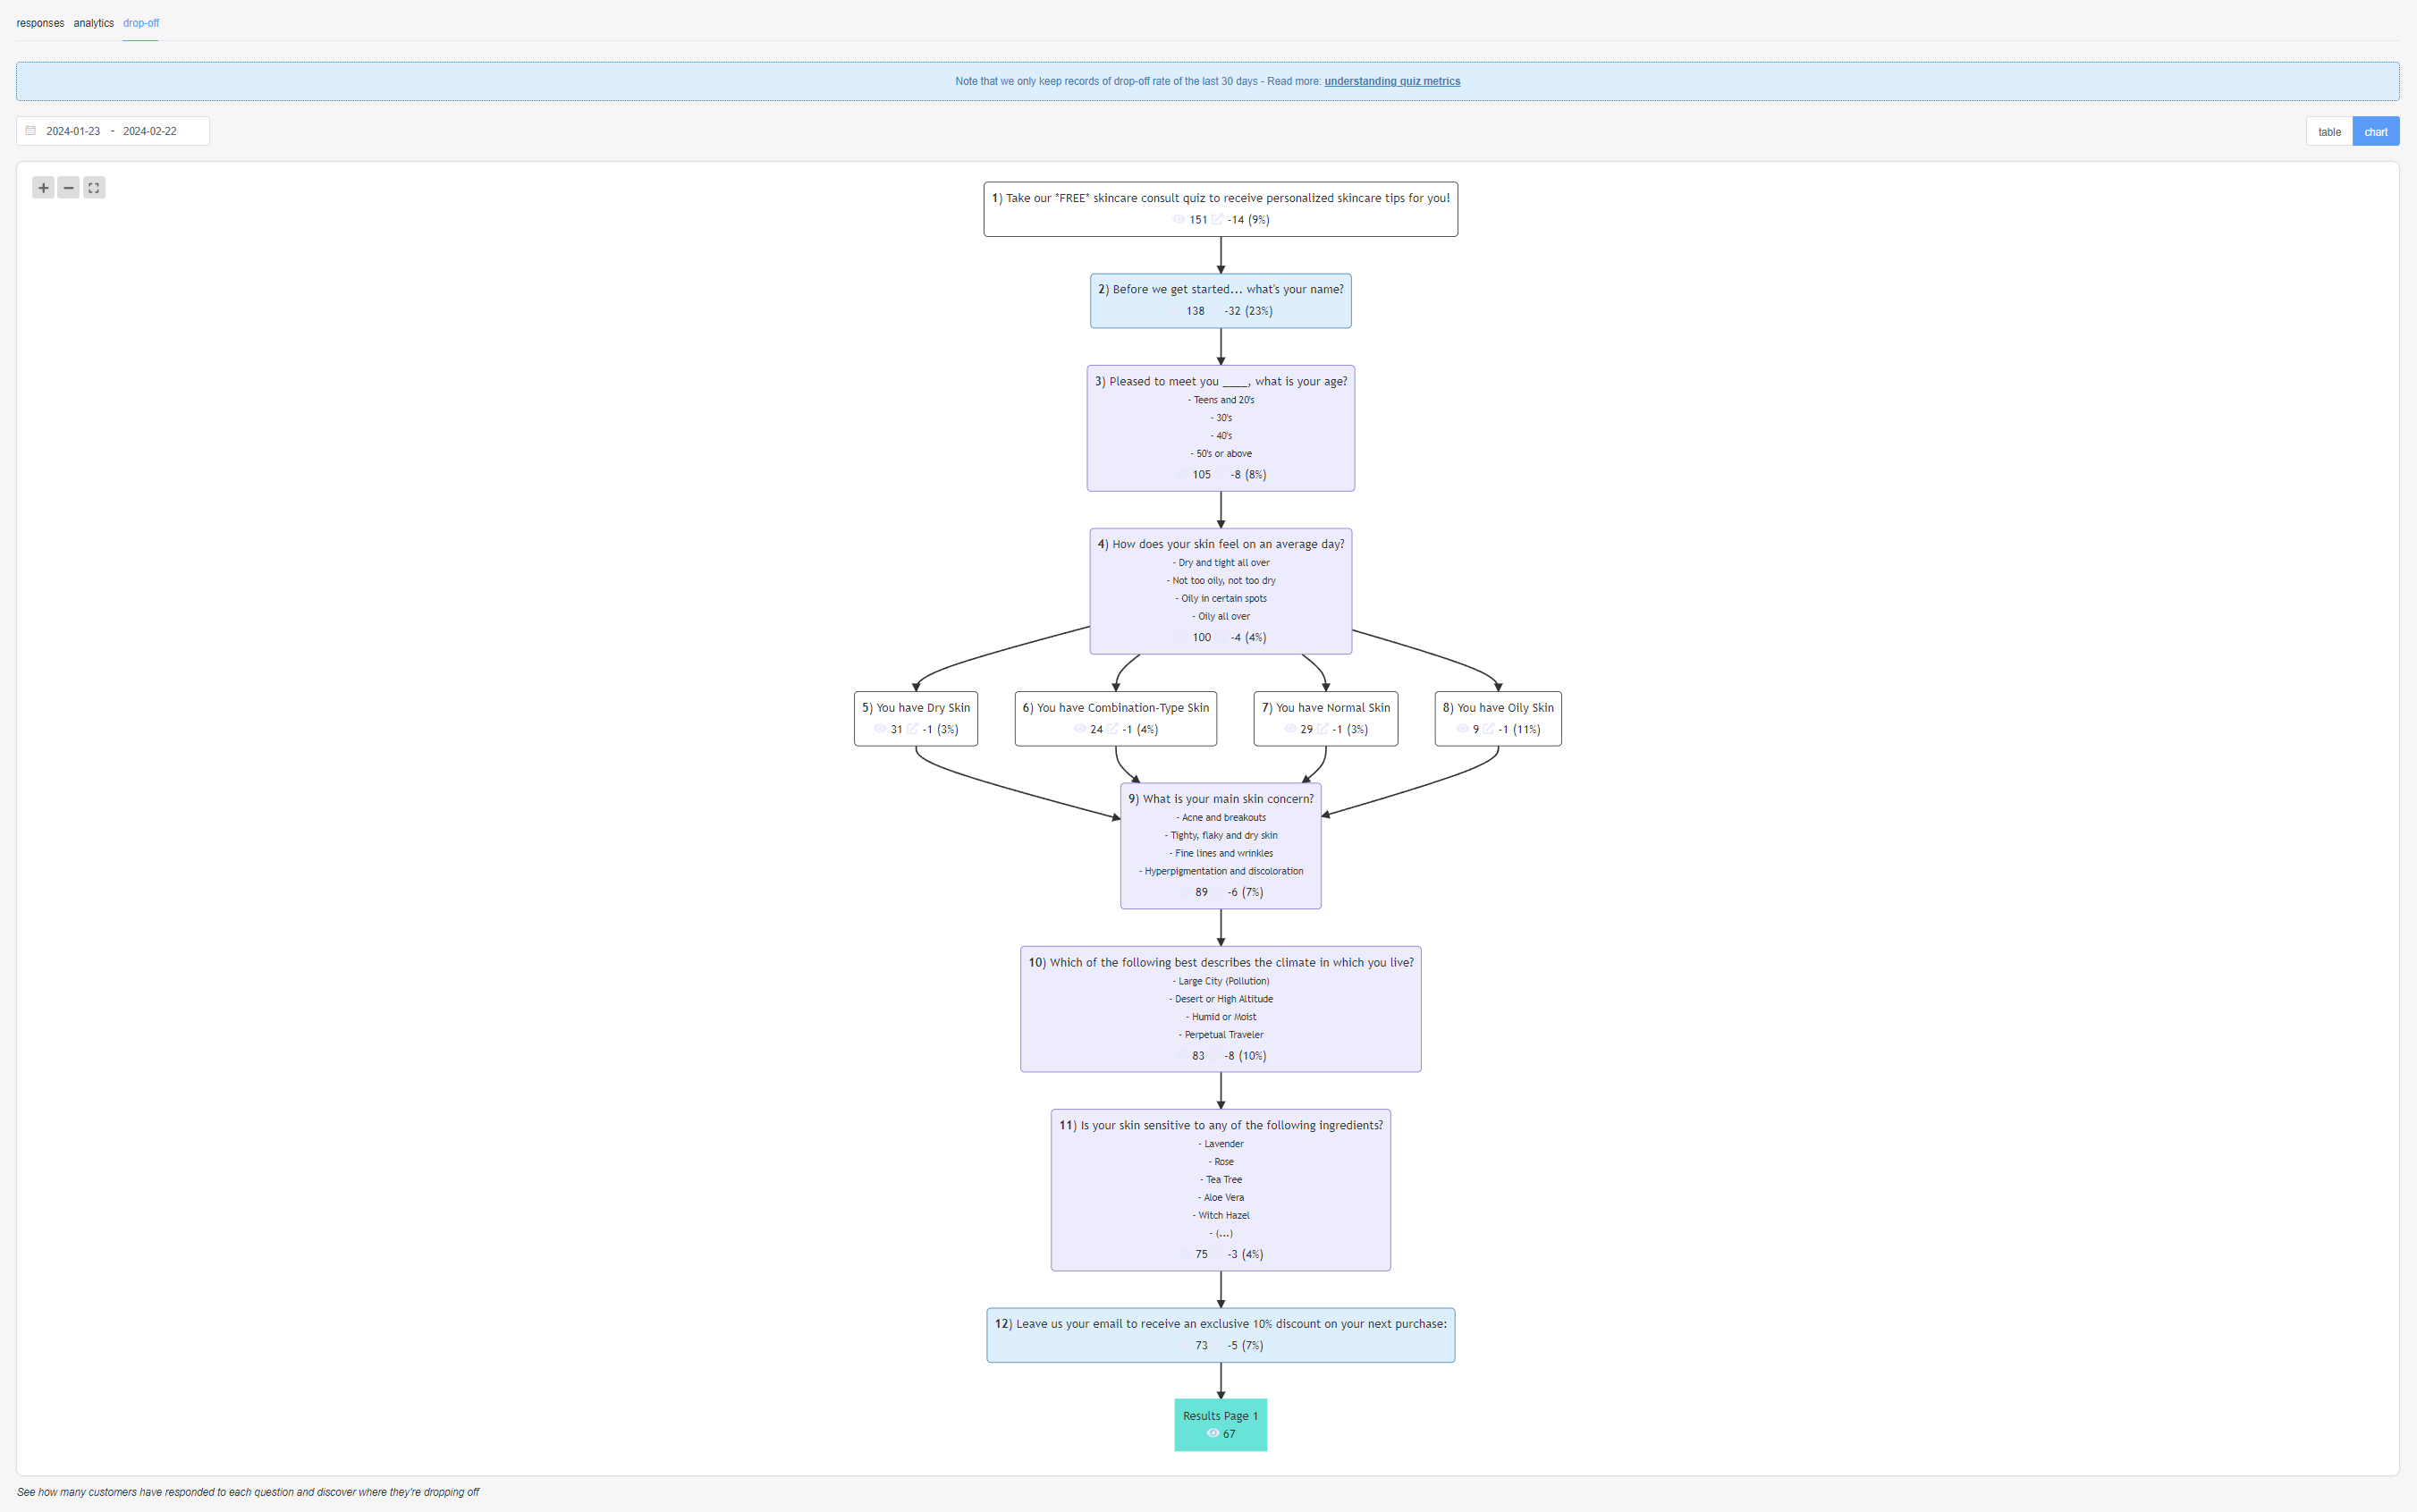
chart - Displays the drop-off rate for each question and the results page in a chart format.
Tip: Analytics Per Choice
To see the list of most-clicked choices, download the responses as a CSV file. You can then analyze it in Google Sheets or Microsoft Excel.
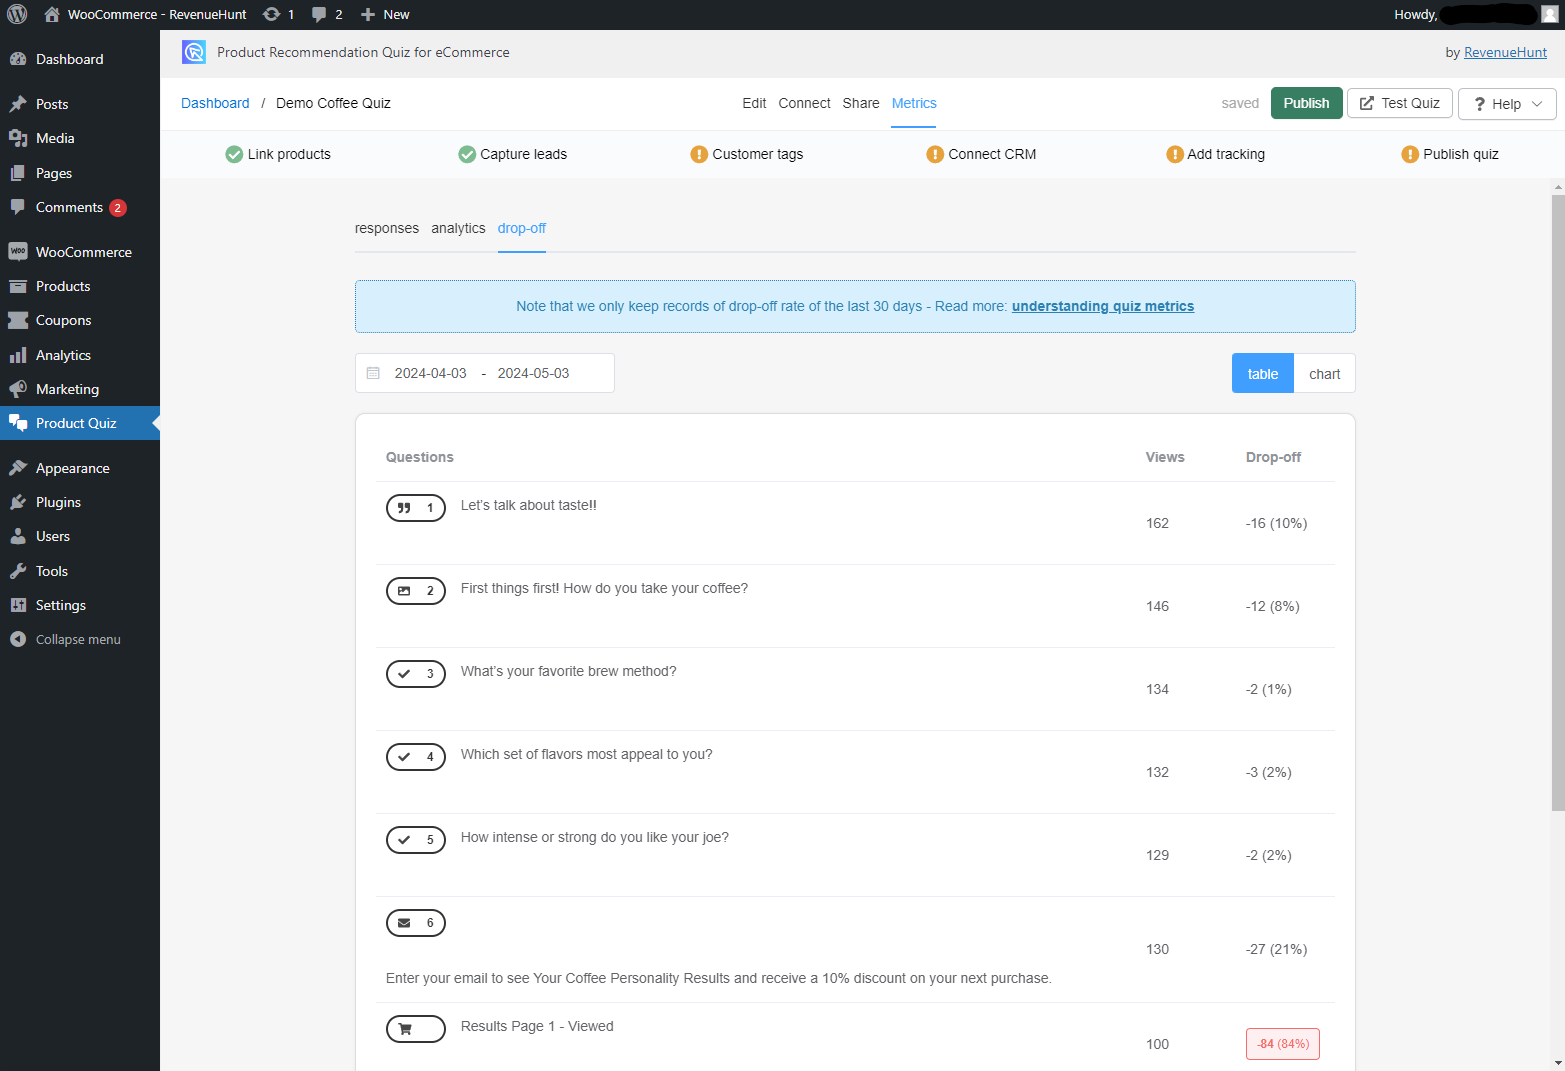
The drop-off rate is measured from events, which fire whenever someone starts a quiz. Ad blockers in the browser can block some of those start events. The quiz starts figure in the analytics tab is adjusted to include the blocked starts, so it can differ from the drop-off rate.
To change the dates click on the 📆 icon. You can change the period to select it from the moment you started using the quiz or from a given date.
table - Displays the drop-off rate for each question and the results page in a table format.
chart - Displays the drop-off rate for each question and the results page in a chart format.
Tip: Analytics Per Choice
To see the list of most-clicked choices, download the responses as a CSV file. You can then analyze it in Google Sheets or Microsoft Excel.
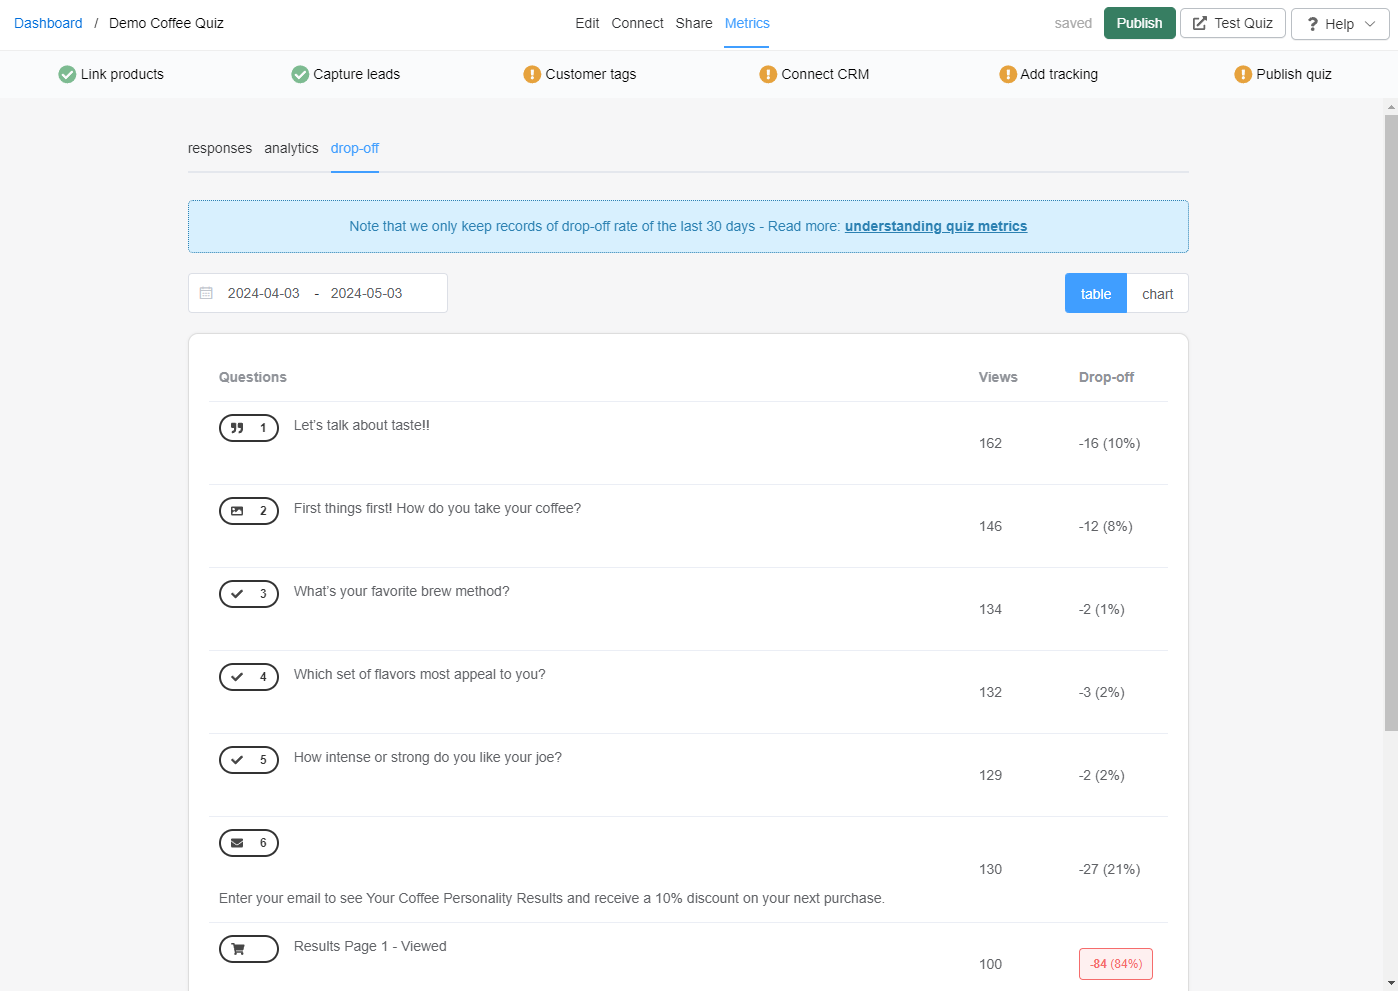
The drop-off rate is measured from events, which fire whenever someone starts a quiz. Ad blockers in the browser can block some of those start events. The quiz starts figure in the analytics tab is adjusted to include the blocked starts, so it can differ from the drop-off rate.
To change the dates click on the 📆 icon. You can change the period to select it from the moment you started using the quiz or from a given date.
table - Displays the drop-off rate for each question and the results page in a table format.
chart - Displays the drop-off rate for each question and the results page in a chart format.
Tip: Analytics Per Choice
To see the list of most-clicked choices, download the responses as a CSV file. You can then analyze it in Google Sheets or Microsoft Excel.
The drop-off rate is measured from events, which fire whenever someone starts a quiz. Ad blockers in the browser can block some of those start events. The quiz starts figure in the analytics tab is adjusted to include the blocked starts, so it can differ from the drop-off rate.
To change the dates click on the 📆 icon. You can change the period to select it from the moment you started using the quiz or from a given date.
table - Displays the drop-off rate for each question and the results page in a table format.
chart - Displays the drop-off rate for each question and the results page in a chart format.
Tip: Analytics Per Choice
To see the list of most-clicked choices, download the responses as a CSV file. You can then analyze it in Google Sheets or Microsoft Excel.
The drop-off rate is measured from events, which fire whenever someone starts a quiz. Ad blockers in the browser can block some of those start events. The quiz starts figure in the analytics tab is adjusted to include the blocked starts, so it can differ from the drop-off rate.
To change the dates click on the 📆 icon. You can change the period to select it from the moment you started using the quiz or from a given date.
table - Displays the drop-off rate for each question and the results page in a table format.
chart - Displays the drop-off rate for each question and the results page in a chart format.
Tip: Analytics Per Choice
To see the list of most-clicked choices, download the responses as a CSV file. You can then analyze it in Google Sheets or Microsoft Excel.
← Previous: Share / Publish